The Greats Series – Tier 3 Part 2
7 min read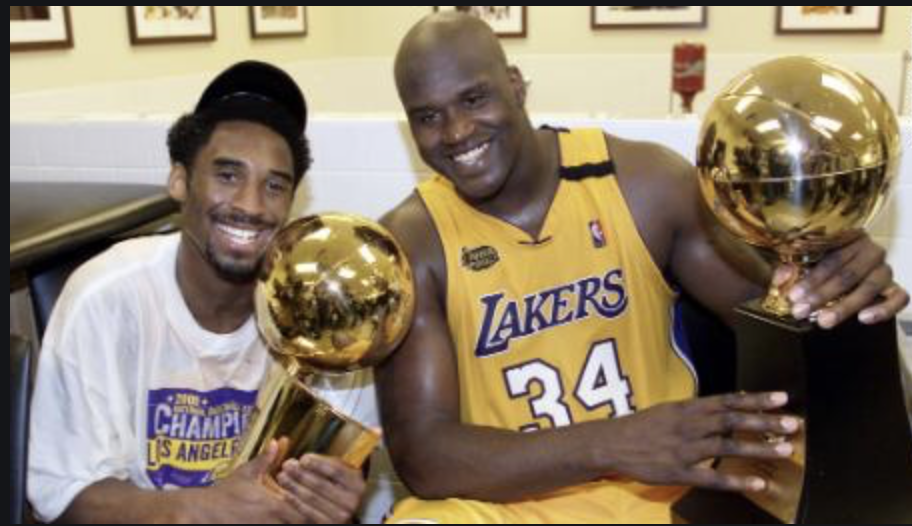
Who are the Fifteen Greatest NBA Players of All Time?
First, a few notes. One, this is a reflection of how I see things today. Any active players can obviously change the equation with the rest of their careers. Two, “greatest” for me is a mix between career production and playoff success. To be in this group, you need to have one of three things – great numbers and great playoff performance, all-time numbers and decent playoff performance, or decent numbers and all-time playoff performance. Third, I will be breaking these rankings into tiers. Those tiers are based on small (or big in some cases) gaps between a set of players and the guys behind them.
Here is Tier 3, the competition between Kobe Bryant and Shaquille O’Neal for the sixth and seventh spots.
Part 1 – regular season numbers – is here.
Playoff Performance:
This is going to be more subjective than the first part, but I’ll do the best I can to come up with a comparable ranking here. There were, without ties, 60 points on the line for the numbers, so there will be 60 points on the line here as well. I have seven categories here – championships, Finals record, Finals appearances, Finals MVPs, supporting casts, opponents, and overall postseason record. Those first four and the last one are very clear measures of postseason success, while looking at supporting casts (in Finals seasons) and Finals opponents will give a little bit of context beyond the clear but basic measures that the other categories give us.
1) Let’s start with championships
| Player | Championships |
| O’Neal | 4 |
| Bryant | 5 |
Kobe has 5 rings. Shaq has 4. Bryant won two without Shaq while O’Neal only won one without Kobe.
- Kobe
- Shaq
2) Now, we’ll look at Finals records
| Player | Finals Record | Finals Winning Percentage |
| O’Neal | 4-2 | 66.7% |
| Bryant | 5-2 | 71.4% |
Kobe went to one more Finals and got the win there. He gets the win in this category too.
1) Kobe
1) Shaq
3) Now we’ll look at Finals appearances
| Player | Finals Appearances | Percentage of Seasons with
Finals Appearance |
| O’Neal | 6 | 31.6% |
| Bryant | 7 | 35% |
This one is pretty close, but again that extra Finals that Kobe reached gives him the edge. He made one more trip to the last round and did it in a slightly higher percentage of his seasons.
- Kobe
- Shaq
4) Now let’s take a look at supporting casts
There’s no great way to measure a supporting cast, but I’ll use the top three teammate win shares for each Finals season. The seasons that ended in championships are in bold. The last column is the sum of the top 3 teammate postseason win shares. It’s not necessarily the win shares of the three players listed for that regular season, but those players are obviously among the top 3 in the playoffs too more often than not. To (sort of) measure roles, I italicized any teammates that produced more regular season win shares than O’Neal or Bryant, and the playoff win shares are italicized if one of those three didn’t lead the way in the playoffs that year. The seasons are more or less ranked by total combined regular season and playoff win shares, though there were some arbitrary decisions made when the numbers are close. Since they played on the same team for a few of these, there are duplicates of some years – with one from Shaq’s perspective and the other from Kobe’s perspective.
| Year/Team | Top WS Teammate | 2nd | 3rd | Total Top 3 WS | Top 3 WS in Playoffs |
| ‘00 Lakers | Shaquille O’Neal (18.6) | Glen Rice (9.0) | Robert Horry (5.7) | 33.3 | 7 |
| ‘09 Lakers | Pau Gasol (13.9) | Lamar Odom (6.9) | Derek Fisher (6.3) | 27.1 | 9.1 |
| ‘95 Magic | Penny Hardaway (10.7) | Horace Grant (9.5) | Nick Anderson (8.3) | 28.5 | 6.5 |
| ‘01 Lakers | Shaquille O’Neal (14.9) | Glen Rice (6.5) | Rick Fox (5.1) | 26.5 | 7.8 |
| ‘10 Lakers | Pau Gasol (11.0) | Andrew Bynum (7.8) | Lamar Odom (7.7) | 26.5 | 7.7 |
| ‘06 Heat | Dwyane Wade (14.0) | Udonis Haslem (7.0) | Alonzo Mourning (4.8) | 25.8 | 8.4 |
| ‘02 Lakers | Shaquille O’Neal (13.2) | Robert Horry (6.9) | Derek Fisher (5.5) | 25.6 | 7.3 |
| ‘02 Lakers | Kobe Bryant (12.7) | Robert Horry (6.9) | Derek Fisher (5.5) | 25.1 | 6.1 |
| ‘00 Lakers | Kobe Bryant (10.6) | Glen Rice (9.0) | Robert Horry (5.7) | 25.3 | 4.4 |
| ‘01 Lakers | Kobe Bryant (11.3) | Glen Rice (6.5) | Rick Fox (5.1) | 22.9 | 7.9 |
| ‘04 Lakers | Shaquille O’Neal (9.9) | Gary Payton (8.1) | Karl Malone (4.3) | 22.3 | 6.2 |
| ‘04 Lakers | Kobe Bryant (10.7) | Gary Payton (8.1) | Karl Malone (4.3) | 23.1 | 5.2 |
| ‘08 Lakers | Lamar Odom (9.7) | Derek Fisher (5.7) | Andrew Bynum (4.8) | 20.2 | 6.2 |
In their four championship runs together, O’Neal had the best regular season win share numbers three times (‘00, ‘01, ‘02) and the best playoff win share numbers three times (‘00, ‘02, ‘04). He was the more impactful player on those teams. As a result, he had the weaker supporting casts during their shared time in LA. The question then becomes their supporting casts after LA. Shaq’s Magic Finals team was headlined by two young players in O’Neal and Hardaway, but it was a solid team with better third and fourth options than any of O’Neal’s other teams. The ‘06 Heat were Dwyane Wade’s team, and he led Miami by a wide margin in regular season and playoff win shares as Shaq played a secondary role as a 33 year old. O’Neal had a decent amount of help in his two non-Laker championship runs, though he was still clearly the best player in Orlando. Kobe got an elite Pau Gasol season in ‘09, which put Gasol over Bryant in regular season win shares and put that year’s supporting cast at number two on the list above. Gasol again led the team in win shares in ‘10, this time both in the regular season and the playoffs. Andrew Bynum and Lamar Odom also stepped up that year to put the ‘10 supporting cast in the top five, and giving Kobe four of the top five and five of the top seven supporting casts above. It should also be noted that the ‘08 Lakers only got roughly 30 games each from Gasol and Bynum due to a midseason trade and injuries. This one isn’t a hard decision.
- Shaq
- Kobe
5) Now let’s look at Finals opponents
There are a number of ways to do this, but let’s keep it simple. We’re just going to look at SRS numbers. Championship wins are again in bold. The table is ordered by SRS margin, which is calculated by SRS – Opponent’s SRS.
| Year/Team | SRS | Opponent | Opponent’s SRS | SRS Margin |
| ‘00 Lakers | 8.41 | Pacers | 4.15 | +4.26 |
| ‘95 Magic | 6.32 | Rockets | 2.44 | +3.88 |
| ‘02 Lakers | 7.15 | Nets | 3.67 | +3.48 |
| ‘10 Lakers | 4.78 | Celtics | 3.37 | +1.41 |
| ‘09 Lakers | 7.11 | Magic | 6.48 | +0.63 |
| ‘01 Lakers | 3.74 | Sixers | 3.63 | +0.11 |
| ‘04 Lakers | 4.35 | Pistons | 5.04 | -0.69 |
| ‘08 Lakers | 7.34 | Celtics | 9.30 | -1.96 |
| ‘06 Heat | 3.59 | Mavs | 5.96 | -2.37 |
This is a pretty close one. The Lakers had the SRS edge heading into all three of their Shaq-Kobe titles, though the Sixers were surprisingly close in ‘01. Kobe also had a relatively small but still clear SRS advantage in both of his titles without Shaq. He lost both of his match-ups as an SRS underdog, including one with Shaq. O’Neal, on the other hand, won once as an SRS underdog alongside Dwyane Wade in ‘06. That would seem to give him the win here, but he also lost as a significant SRS favorite in ‘95. That said, that Orlando team was young, and that series was, despite the lower SRS number, against the defending champions, who happened to have an all-time great (Hakeem Olajuwon) who had averaged 28 points and 11 boards per game that year. Shaq also led the league in playoff win shares that postseason. I’m going to give him a small edge in this category.
- Shaq
- Kobe
6) Now let’s look at Finals MVPs
| Player | Finals MVPs |
| O’Neal | 3 |
| Bryant | 2 |
Shaq won three straight Finals MVPs when the Lakers won their three straight titles in ‘00, ‘01, and ‘02. Bryant was credited as the main man during the two Finals runs later in his career despite Gasol’s presence, but Shaq had the reins early on.
- Shaq
- Kobe
7) Now let’s take a look at overall playoff record
| Player | Playoff Record | Playoff Winning Percentage |
| O’Neal | 129-87 | 59.72% |
| Bryant | 135-89 | 60.27% |
That’s a half percent difference on basically the same amount of games. It’s a tie.
1) Kobe
1) Shaq
So, where does that leave us? Was O’Neal or Bryant more impressive in the playoffs?
| Categories | Points |
| Championships | 10 |
| Finals Record | 7.5 |
| Finals Appearances | 5 |
| Supporting Casts | 5 |
| Opponents | 5 |
| Finals MVPs | 5 |
| Overall Playoff Record | 2.5 |
First place in a category gets you the number of points listed above. Second gets you ½ of that value. Let’s see how Shaq and Kobe stack up.
| Category | Shaq | Kobe |
| Championships | 5 | 10 |
| Finals Record | 3.75 | 7.5 |
| Finals Appearances | 2.5 | 5 |
| Supporting Casts | 5 | 2.5 |
| Opponents | 5 | 2.5 |
| Finals MVPs | 5 | 2.5 |
| Overall Playoff Record | 2.5 | 2.5 |
| Total Points | 28.75 | 32.5 |
And there you have that. Based on postseason success,
- Kobe – 32.5 points
- Shaq – 28.75 points
This brings us to the overall leaderboard, where we combine regular season production with postseason success to rank these two 6 and 7 in NBA history. Both O’Neal and Bryant are set up to earn a spot on my all-time Lakers Mount Rushmore with Kareem and Magic, but this tier ranking determines who would be third and who would be fourth. Shaq has the edge in overall career production, but Kobe’s fifth title win in 2010 cemented his postseason legacy and pushed him just past Shaq.
6) Kobe Bryant – 62 points
7) Shaquille O’Neal – 60.75 points
A note that these point values have nothing to do with the overall top 15 rankings. They are just associated with each individual tier.
Next up is Tier 4, where we take a look at the two best players of the early NBA.