
The Greats Series – Tier 3 Part 1
11 min read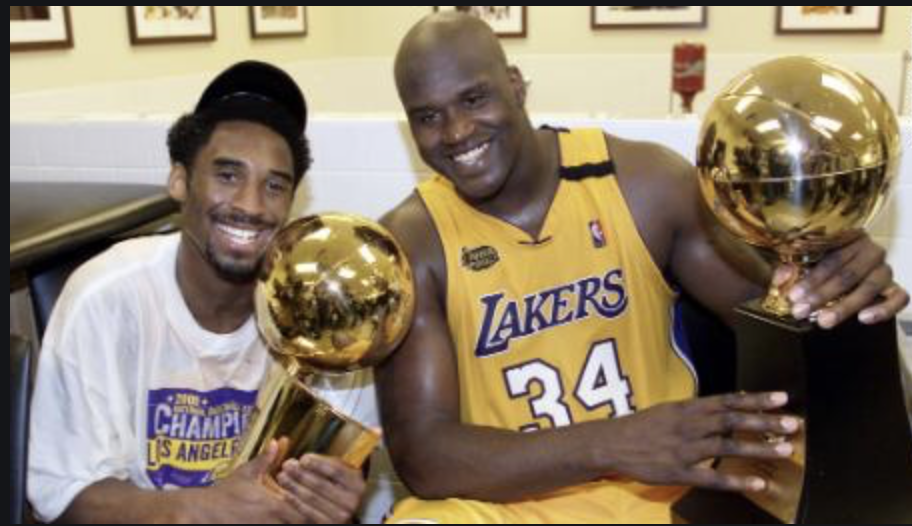
Who are the Fifteen Greatest NBA Players of All Time?
First, a few notes. One, this is a reflection of how I see things today. Any active players can obviously change the equation with the rest of their careers. Two, “greatest” for me is a mix between career production and playoff success. To be in this group, you need to have one of three things – great numbers and great playoff performance, all-time numbers and decent playoff performance, or decent numbers and all-time playoff performance. Third, I will be breaking these rankings into tiers. Those tiers are based on small (or big in some cases) gaps between a set of players and the guys behind them.
Here is Part 1 of Tier 3, the competition for the sixth and seventh spots.
TIER 3: Laker Legends
* No order below
Shaquille O’Neal
Kobe Bryant
This is where I explain why I have Shaq and Kobe here – and not in the top 5. I’ll start by saying that the NBA is near the end of its 71st season right now. I’m ranking my fifteen greatest players from those 71 years. So, with that in mind, any criticisms that I’m about to make are very relative. These are two of the absolute greatest to ever pick up the basketball; I just think that there were five guys that did it better. The way I see it, the all-around excellence that those in the top two tiers possessed outshines that of Kobe and Shaq.
MJ was perhaps the best scorer in NBA history, an elite defensive guard by every measure, and the owner of a 6-0 Finals record. There really weren’t flaws in his game.
Kareem owns the most dominant offensive move in NBA history, and he rode that to the most career points in NBA history. His 20-year career, a career that saw him play at least 62 games twenty times, at least 74 games eighteen times, and at least 80 games eleven times, is the greatest feat of longevity the league has ever seen, and it has him on top of the rest in career win shares and offensive win shares. He also won 6 titles and reached The Finals in half of his seasons.
LeBron might be the most talented basketball player of all-time – a player with rarely matched IQ in a bruising linebacker-like body. He is on pace to become the second player in NBA history (Oscar Robertson) to average at least 25 points, 7 assists, and 7 boards per game over a full career, and that all-around versatility more than makes up for his occasional failure to live up to his dominant potential defensively. He has reached The Finals in over half of his seasons, carrying some really poor supporting casts there along the way, and his 3-6 record in the championship round has come with him playing the underdog (sometimes by a lot) in seven of those nine match-ups.
Magic is the best pure point guard in NBA history, and he got there in a 6’9” body that, in some ways, redefined positional parameters in basketball. He reached an absurd nine Finals in only thirteen seasons, winning five of them.
Larry Legend is one of the smartest to ever do it offensively, putting up elite numbers across the board despite his physical limitations. He was also a really good rebounder (10 per game over his career) and a sneaky stud defensively, racking up more five defensive win share seasons than LeBron in four less overall seasons. He won in three of his five trips to The Finals.
Those five have the best statistical resumes and the most impressive lists of individual awards, and their postseason achievements are competitive with or outshine those of Bryant and O’Neal, who won three of their titles with each other when both were in their 20s.
Kobe and Shaq just had more holes than the five above them. Their dominance was more concentrated in a specific area (scoring for Kobe and paint dominance for Shaq). They can’t claim the same level of all-around production, and their peaks of individual production didn’t reach quite the same levels. They were warriors, often dominant offensively, and clutch performers when it mattered. That leaves them just short of the top five. Let’s see who ends up sixth and who ends up seventh.
The Regular Season Numbers:
A longer description of this process can be found here, but here’s the gist – we have 34 total stats that we’re looking at, along with turnovers, fouls, and seasons played (not part of the 35), and regular season awards.
1) Let’s start with a look at how each player’s statistical profiles (the 35) rank up historically…
| Stats in the… | O’Neal | Bryant |
| Top 100 | 26 | 18 |
| Top 50 | 24 | 14 |
| Top 25 | 18 | 9 |
| Top 10 | 6 | 3 |
| Top 5 | 2 | 2 |
| Top 3 | 0 | 1 |
| Best All Time | 0 | 0 |
Shaq’s efforts in the paint put him on the all-time leaderboard in a huge number of stats. Neither Kobe or Shaq broke into the top 5 in a lot of statistical areas, but Kobe has a slight edge there with two appearances in the top 5 and one in the top 3. That’s a small difference, and it’s not enough to overcome the huge edge that O’Neal has in overall volume and top 10 appearances.
- Shaq
- Kobe
2) Now we’ll look at scoring stats: points (per game and total), Field Goal %, Effective Field Goal %, True Shooting %, Three-Point %, and Free Throw %. We’ll also throw in Scoring Championships here.
| Stat | O’Neal | Bryant |
| Points Per Game | 23.7 | 25.0 |
| Career Points | 28,596 (8th) | 33,643 (4th) |
| FG% | 58.2 (7th) | 44.7 |
| EFG% | 58.2 (8th) | 48.2 |
| TS% | 58.6 | 55.0 |
| 3P% | 4.5 | 32.9 |
| FT% | 52.7 | 83.7 |
| Scoring Champ | 2 times | 2 times |
Both Bryant and O’Neal were dominant scorers in their own way. O’Neal did his work around the rim, scoring just under 24 points per game on historic efficiency numbers. That work never extended beyond the paint though. He was terrible from the free throw line (52.7%) and nonexistent from behind the arc (4.5% on limited attempts). That didn’t impact his overall production, as Shaq still scored at a good enough rate to lead the league in scoring twice. Bryant, on the other hand, did a lot of his scoring through isolation, dropping exactly 25 points per game over the course of his career. He scored about 5,000 more points than Shaq to land at fourth on the all-time points leaderboard, and he also won two scoring titles. That approach hurt his efficiency, and Bryant was consistently at or below average from the field and from three. He scored through volume, taking roughly 3.5 more shots per game than O’Neal to get that extra 1.3 points per game. Both were absolute killers with the ball in their hands. I’m calling this one a tie.
1) Shaq
1) Kobe
3) Now we’ll look at passing stats – assists (per game and total) and assist percentage
| Stat | O’Neal | Bryant |
| Assists Per Game | 2.5 | 4.7 |
| Career Assists | 3,026 | 6,306 |
| Assists Percentage | 13.9 | 24.2 |
Kobe was a better passer than he gets credit for, though he was admittedly never a big assist guy. Either way, he still has a clear edge over Shaq here. That said, O’Neal wasn’t a terrible passer considering his position. Just for the sake of reference, Shaq averaged more assists per game in his first two seasons than Jayson Tatum put up in his, and Tatum would only hold a 0.2 assist edge in year number three, though he will get a chance to build on that edge this summer (*knocks on twenty-five pieces of wood).
- Kobe
- Shaq
4) Now we’ll look at rebounding stats – rebounds (per game and total), offensive rebounds (per game and total), defensive rebounds (total), and rebound percentage
| Stat | O’Neal | Bryant |
| Rebounds Per Game | 10.9 | 5.2 |
| Career Rebounds | 13,099 | 7,047 |
| Offensive Rebounds Per Game | 3.5 (5th – tie) | 1.1 |
| Career Offensive Rebounds | 4,209 (7th) | 1,499 |
| Career Defensive Rebounds | 8,890 | 5,548 |
| Rebound Percentage | 17.8 | 8.1 |
O’Neal has a legitimate claim to being one of the ten best rebounders to ever play in the NBA. Bryant was a solid but unspectacular rebounder as a guard. It’s a tough call, but I’m leaning towards Shaq.
- Shaq
- Kobe
5) Now we’ll look at steals and blocks – blocks (per games and total), block percentage, steals (per game and total), and steal percentage
| Stat | O’Neal | Bryant |
| Steals Per Game | 0.6 | 1.4 |
| Career Steals | 739 | 1,944 |
| Steal Percentage | 0.9 | 2.1 |
| Blocks Per Game | 2.3 | 0.5 |
| Career Blocks | 2,732 (9th) | 640 |
| Block Percentage | 4.6 | 1.0 |
O’Neal produced about a little over four times the effect of Bryant in terms of blocks. He’s top 25 all-time in blocks per game and block percentage, and he stands in the top 10 all-time in career blocks. Bryant shouldn’t be expected to have those sort of block numbers, but his steal numbers fall well short of the all-time label that Shaq’s block numbers can claim. He was better than Shaq in steals – by a factor of about 2 – but Shaq wins the overall contest here.
- Shaq
- Kobe
6) Now we’ll look at advanced offensive stats – offensive win shares, offensive box +/-, usage rate, and offensive rating
| Stat | O’Neal | Bryant |
| Offensive Win Shares | 115.4 | 122.1 |
| Offensive Box +/- | 4.4 | 4.6 |
| Usage Rate | 29.5 | 31.8 (3rd) |
| Offensive Rating | 113 | 110 |
Bryant actually lost 1.8 offensive win shares over the last three years of his career as he struggled to keep playing through a series of injuries. He still holds the clear edge over O’Neal there. Kobe also holds a small edge in offensive box +/- and owns a top three all-time usage rate. Very few have taken on as big of an offensive load, though Shaq is one of the players within Bryant’s area code. O’Neal’s edge in offensive rating isn’t enough here.
- Kobe
- Shaq
7) Now we’ll look at advanced defensive stats – defensive win shares, defensive box +/-, and defensive rating
| Stat | O’Neal | Bryant |
| Defensive Win Shares | 66.4 | 50.7 |
| Defensive Box +/- | 0.7 | -0.1 |
| Defensive Rating | 98 | 105 |
Shaq has the edge in all three categories here. Bryant wasn’t a terrible defender by any means, but the numbers don’t back up any claims that call him better than just good or decent. His defensive box +/- was around 0.04 heading into his last three seasons. Those seasons sent it into the negatives, but that first number is still well below Shaq’s career input. It is true that these numbers are shifted towards big men. Defensive rating is based on points allowed – and the average opposing guard will likely score more than the average opposing center. Defensive win shares are partially based on defensive rating. But a seven point edge and a 16 win share edge (with less time played on top of that) are still significant in that context. Shaq was a better defender across his career, and he outpaced Kobe at their respective defensive peaks as well.
- Shaq
- Kobe
8) Now we’ll look at overall advanced stats – PER, box +/-, win shares, win shares per 48 minutes, and VORP
| Stat | O’Neal | Bryant |
| PER | 26.4 (4th) | 22.9 |
| Box +/- | 5.1 | 4.6 |
| Win Shares | 181.7 | 172.7 |
| Win Shares Per 48 | .208 | .170 |
| VORP | 75.5 | 80.1 |
O’Neal has the edge in PER, putting up an all-time great average of 26.4, a figure that Bryant only topped once in 20 seasons. Shaq also has the advantage in box +/- due to Kobe’s low defensive numbers there. The defensive advantage carried over to win shares, where Shaq has a clear career edge despite trailing Kobe in total offensive win shares and playing roughly 100 games less than Bryant. Another large piece of that was O’Neal’s ability to produce almost 0.4 more win shares per 48 minutes. Kobe has the lead in career VORP, but that lead is nowhere near big enough to give him the win in this category.
- Shaq
- Kobe
9) Now we’ll look at fouls and turnovers, just to be complete
| Stat | O’Neal | Bryant |
| Fouls Per Game | 3.4 | 2.5 |
| Turnovers Per Game | 2.7 | 3.0 |
I expected Kobe to have a higher turnover average here. LeBron, for instance, has turned the ball over at least 3 times a game in every season of his career for an overall average of 3.5 per game. That’s not a knock on James; more turnovers tend to happen with higher usage rates. Kobe is closer to MJ (2.7 per game) than James though, something I didn’t think would be the case. Shaq had a slightly lower usage rate – and played what should be a lower turnover rate position – so he doesn’t really have much of an edge there. He was whistled for about one foul more per game as well. That makes some sense given his position and physical style of play, but it’ll still give the edge to Kobe in this category.
- Kobe
- Shaq
10) Now we’ll look at longevity – minutes played, minutes played per game, games played, and seasons played
| Stat | O’Neal | Bryant |
| Minutes Played | 41,918 | 48,637 (8th) |
| Minutes Per Game | 34.7 | 36.1 |
| Games Played | 1,197 | 1,346 |
| Seasons Played | 19 | 20 |
Kobe’s season total isn’t a fully accurate reflection of his longevity. He played 6 games in 2014 and 35 in 2015. He failed to reach 70 games in roughly half of his non-lockout seasons. Even if you account for the ‘99 and ‘12 lockouts and give Kobe the extra 40 or so games he would have gotten the chance to play in a normal season, he sits nearly 200 games played behind Kareem Abdul-Jabaar, who also played 20 seasons. That’s roughly 2.5 seasons worth of games. That said, Bryant’s longevity is still an impressive feat, and he outpaces Shaq in every category here. O’Neal had his own issues with injuries and age, and he only played 70 games six times in nineteen years, though he was on track to reach that number in ‘99. He even had five non-lockout seasons where he failed to crack 55 games. Bryant only had the two in ‘14 and ‘15.
- Bryant
- O’Neal
11) Lastly, we’ll look at regular season awards
| Award | O’Neal | Bryant |
| Rookie of the Year | 1 | 0 |
| Defensive Player of the Year | 0 | 0 |
| MVP | 1 | 1 |
| Top 3 in MVP Voting (includes wins) | 5 | 5 |
| All-NBA First Team | 8 | 11 |
| All-NBA Second Team | 2 | 2 |
| All-NBA Third Team | 4 | 2 |
| All-Defensive First Team | 0 | 9 |
| All-Defensive Second Team | 3 | 3 |
| All-Rookie Team | 1 | 1 (second team) |
| All-Star Appearances | 15 | 18 |
Shaq won Rookie of the Year. Kobe did not. Both won one MVP and finished in the top three in voting four other times. Kobe has the edge in total All-NBA selections (15 to 14) and first team selections (11 to 8). He also was picked to the All-Defensive team far more than Shaq, something that the data doesn’t really back up. There’s really no objective reason for Kobe to have made more than a few All-Defensive teams at all, never mind twelve with nine of those being first team selections. Either way, he did make those teams, and Shaq’s award edge in their respective rookie seasons falls short over the long haul here.
- Kobe
- Shaq
So, where does that leave us? Who has the best regular season numbers? Who has the worst?
Let’s answer that question by looking back over the eleven categories. In the second column, I have them ranked on a points system based on how important I think that category is.
| Category | Points |
| Regular Season Awards | 6 |
| Historical Statistic Rankings | 6 |
| Overall Advanced Stats | 6 |
| Scoring | 3 |
| Passing | 3 |
| Rebounding | 3 |
| Steals and Blocks | 3 |
| Offensive Advanced Stats | 3 |
| Defensive Advanced Stats | 3 |
| Longevity | 3 |
| Turnovers and Fouls | 1 |
First place in a category gets you the number of points listed above. Second gets you ½ of that value. Let’s see how Shaq and Kobe stack up.
| Category | Shaq | Kobe |
| Regular Season Awards | 3 | 6 |
| Historical Statistic Rankings | 6 | 3 |
| Overall Advanced Stats | 6 | 3 |
| Scoring | 3 | 3 |
| Passing | 1.5 | 3 |
| Rebounding | 3 | 1.5 |
| Steals and Blocks | 3 | 1.5 |
| Offensive Advanced Stats | 1.5 | 3 |
| Defensive Advanced Stats | 3 | 1.5 |
| Longevity | 1.5 | 3 |
| Turnovers and Fouls | 0.5 | 1 |
| Total Points | 32 | 29.5 |
Well, there you have it.
- SHAQ – 32 points
- KOBE – 29.5 points
Shaq has a pretty small edge based on regular season numbers. We’ll see in Part 2 – coming soon – if he can maintain that edge through a look at playoff performance.
1 thought on “The Greats Series – Tier 3 Part 1”