
The Greats Series – Tier Two
13 min read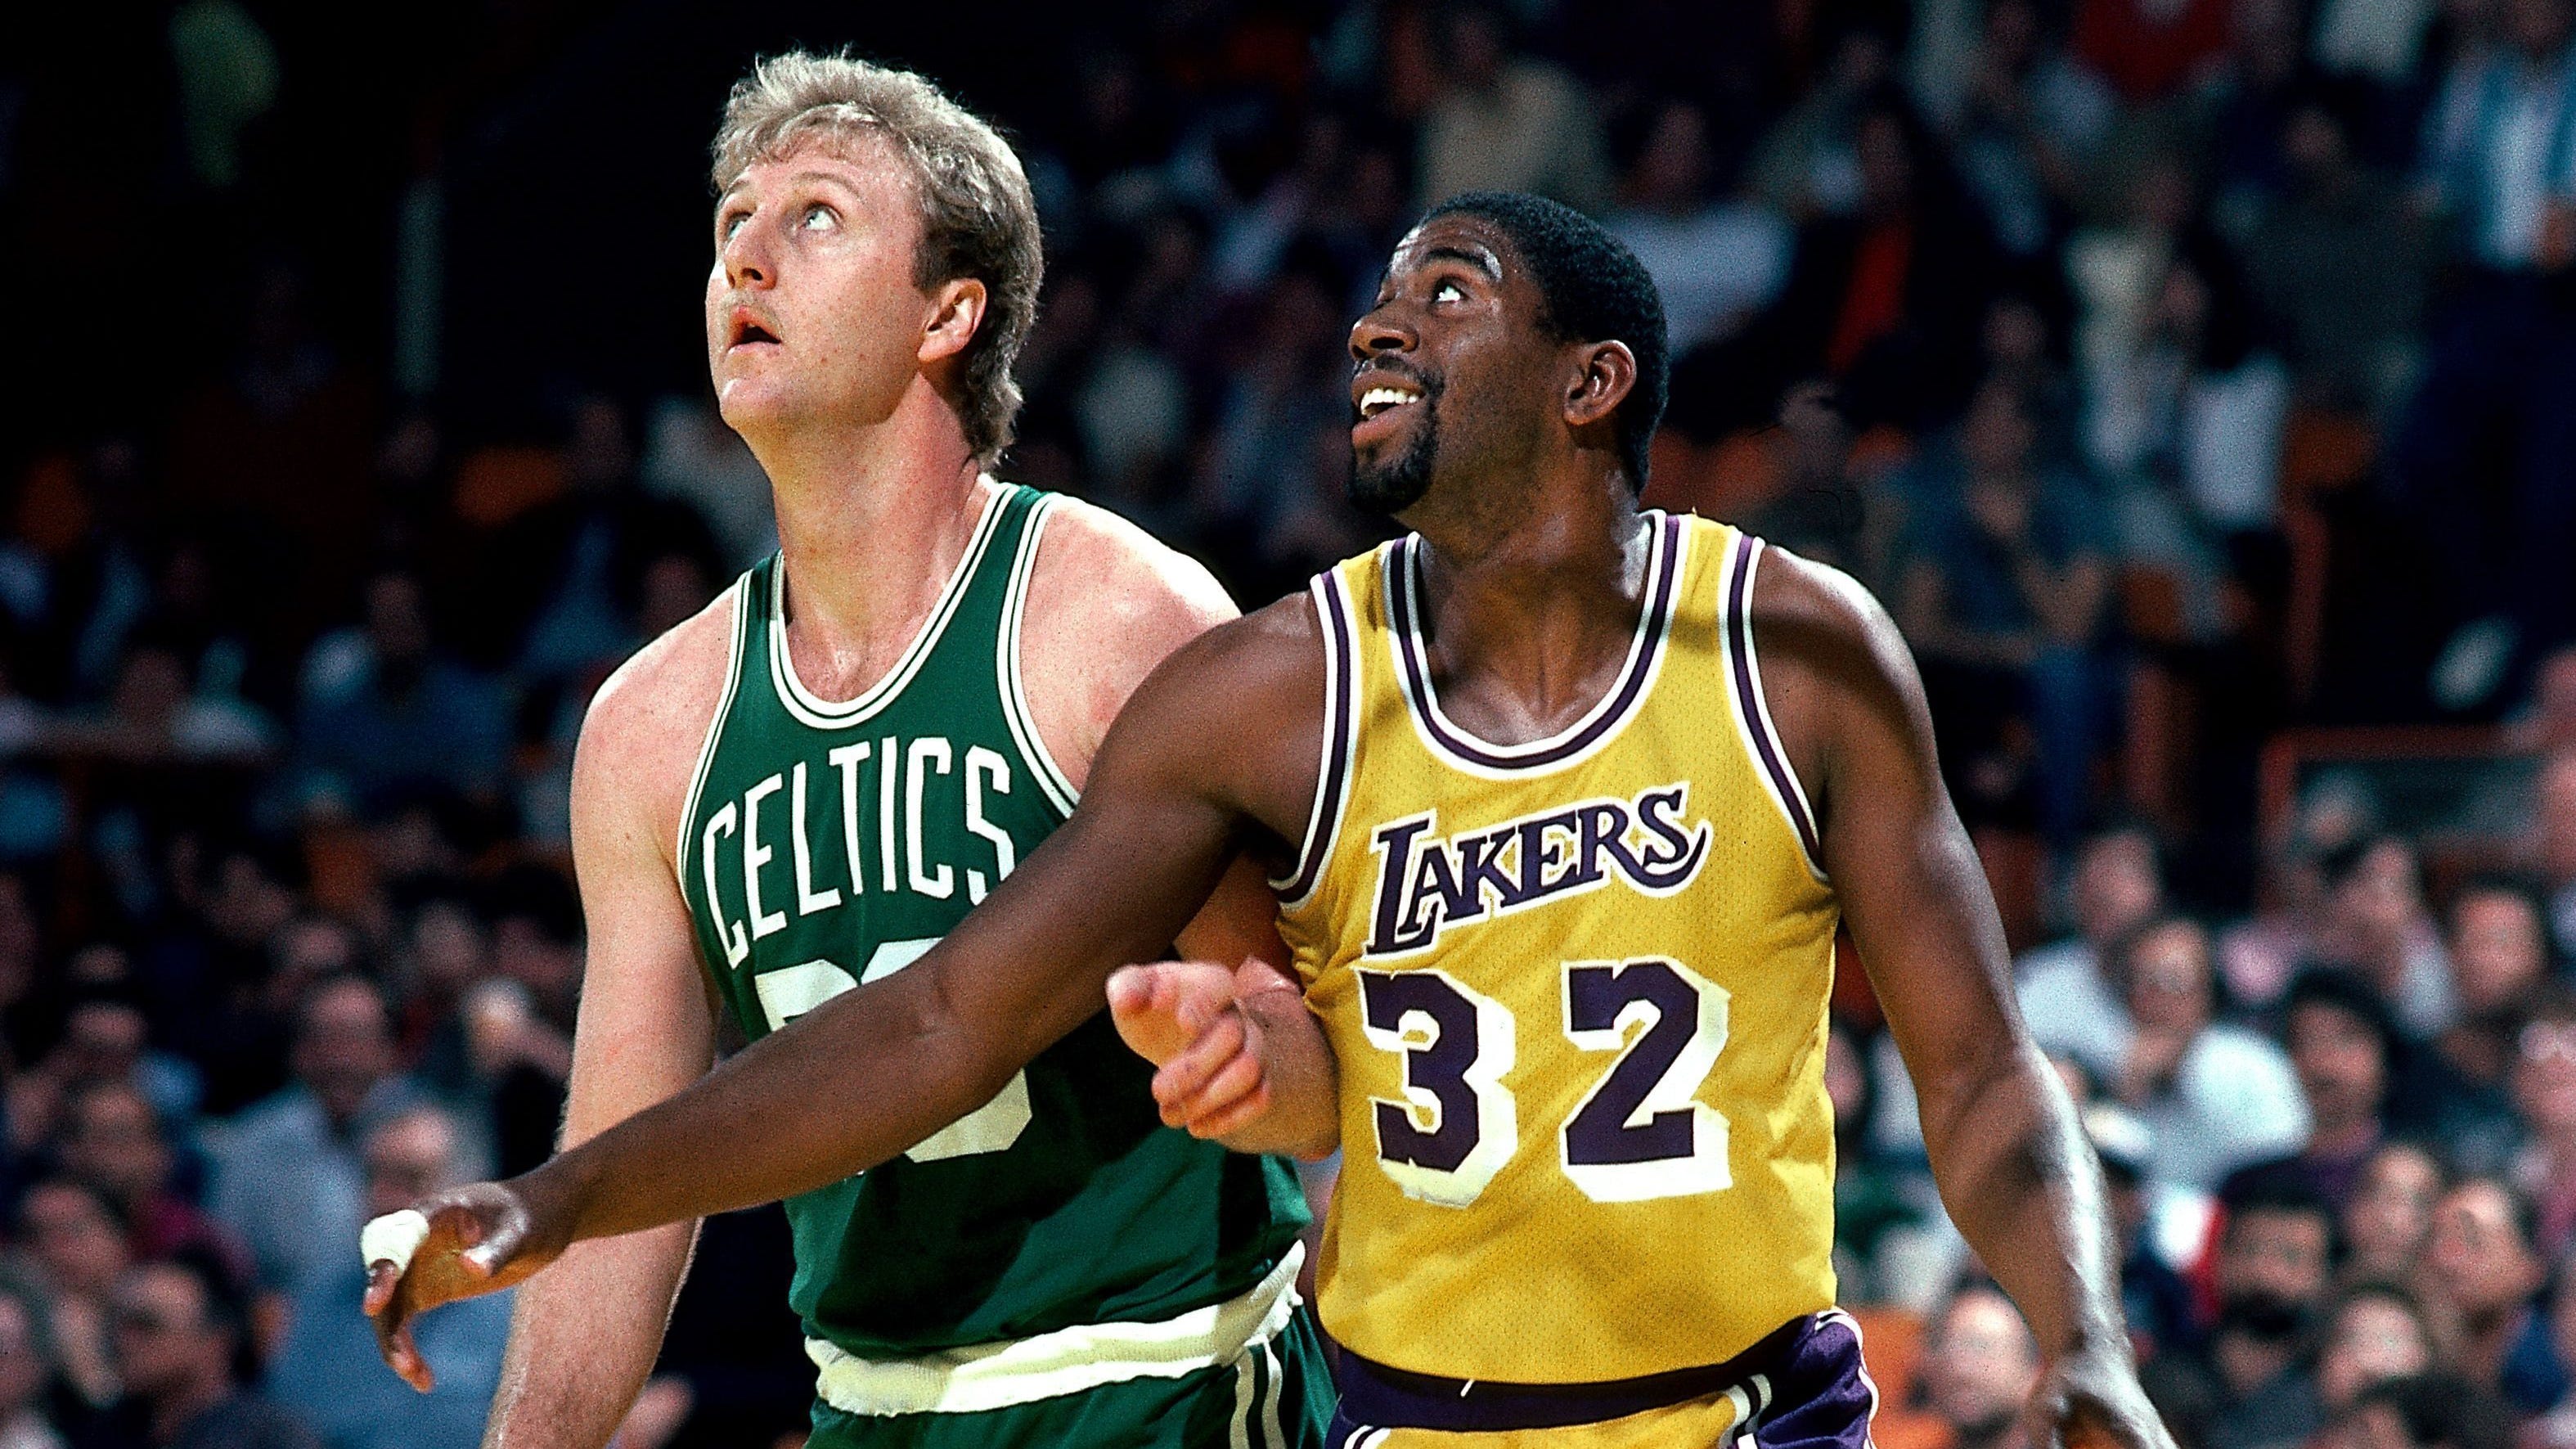
Who are the Fifteen Greatest NBA Players of All Time?
First, a few notes. One, this is a reflection of how I see things today. Any active players can obviously change the equation with the rest of their careers. Two, “greatest” for me is a mix between career production and playoff success. To be in this group, you need to have one of three things – great numbers and great playoff performance, all-time numbers and decent playoff performance, or decent numbers and all-time playoff performance. Third, I will be breaking these rankings into tiers. Those tiers are based on small (or big in some cases) gaps between a set of players and the guys behind them.
Here is Tier 2, the competition for the fourth and fifth spots.
TIER 2: Magic and Larry
* No order below
Magic Johnson
Larry Bird
These were the two best players of the 1980s. They brought what might be the most competitive rivalry between two championship-worthy teams – Bird’s Celtics and Magic’s Lakers – that the NBA has seen. They don’t quite have the resume of Jordan, Abdul-Jabaar, and James, but no one does. These two are the next best thing in terms of talent, historical significance, and championship-level play, and it would be wrong to put them anywhere but together in these rankings.
The Regular Season Numbers:
The numbers we’re looking at here are points (per game and total), assists (per game and total), assist percentage, rebounds (per game and total), offensive rebounds (per game and total), defensive rebounds (total), rebound percentage, blocks (per games and total), block percentage, steals (per game and total), steal percentage, minutes played (per game and total), games played, Usage Rate, PER, Box +/-, Offensive Box +/-, Defensive Box +/-, VORP, Win Shares, Offensive Win Shares, Defensive Win Shares, Field Goal %, Effective Field Goal %, True Shooting %, Three-Point %, and Free Throw %. I didn’t look at total field goal attempts or free throws or threes, or anything relating to total shots, makes, or misses because I see those as repetitive with points and shooting percentages given. That leaves us with a total stat number of 34. Turnovers, fouls, and seasons played will also be discussed, though those two stats are not included in the total stat number.
Regular season awards – MVP, All-NBA, All-Defense, Rookie of the Year, Defensive Player of the Year – are also part of this category. Top three finishes in the MVP race were also considered, as were any seasons in which a player led the league in points, rebounds, assists, steals, or blocks per game.
1) Let’s start with a look at how each player’s statistical profiles rank up historically…
| Stats in the… | Johnson | Bird |
| Top 100 | 25 | 24 |
| Top 50 | 15 | 18 |
| Top 25 | 14 | 8 |
| Top 10 | 7 | 2 |
| Top 5 | 4 | 0 |
| Top 3 | 1 | 0 |
| Best All Time | 1 | 0 |
This one isn’t close. Magic’s passing numbers and some of his advanced stats go higher on the all-time leaderboard than Bird’s, who only matches Johnson at the top, less important side of this table.
- Magic
- Larry
2) Now we’ll look at scoring stats: points (per game and total), Field Goal %, Effective Field Goal %, True Shooting %, Three-Point %, and Free Throw %. We’ll also throw in Scoring Championships here.
| Stat | Johnson | Bird |
| Points Per Game | 19.5 | 24.6 |
| Career Points | 17,707 | 21,791 |
| FG% | 52.0 | 46.6 |
| EFG% | 53.3 | 51.4 |
| TS% | 61.0 | 56.4 |
| 3P% | 30.3 | 37.6 |
| FT% | 84.8 | 88.6 |
| Scoring Champ | 0 times | 0 times |
Bird was clearly the better volume scorer here, averaging roughly five more points per game than Johnson. He was also a more effective shooter, hitting a noticeably higher percentage of his shots from beyond the arc and from the free-throw line. His field goal percentages are lower, but he was also asked to take on a much larger scoring load than Johnson, shooting roughly 19 times a game compared to 13 for Magic. That’ll lead to less efficient scoring at times. Bird wins here.
- Larry
- Magic
3) Now we’ll look at passing stats – assists (per game and total) and assist percentage
| Stat | Johnson | Bird |
| Assists Per Game | 11.2 (1st All-Time) | 6.3 |
| Career Assists | 10,141 (5th) | 5,695 |
| Assists Percentage | 40.9 (7th) | 24.7 |
This is pretty clear cut. Bird was a gifted passer with a renowned basketball IQ. Johnson might be the best passer in NBA history. John Stockton sits nearly 0.7 assists per game behind Magic on the all-time leaderboard. Johnson led the league in assists four times. Being a pure point guard in a 6’9” body will do that for you.
- Magic
- Larry
4) Now we’ll look at rebounding stats – rebounds (per game and total), offensive rebounds (per game and total), defensive rebounds (total), and rebound percentage
| Stat | Johnson | Bird |
| Rebounds Per Game | 7.2 | 10.0 |
| Career Rebounds | 6,559 | 8,974 |
| Offensive Rebounds Per Game | 1.8 | 2.0 |
| Career Offensive Rebounds | 1,601 | 1,757 |
| Career Defensive Rebounds | 4,958 | 7,217 |
| Rebound Percentage | 11.1 | 14.5 |
This one is pretty clear cut too. Bird has the advantage in every rebounding stat here despite having virtually the same exact body size as Johnson. Bird, when he played, was 6’9” and weighed 220 pounds. Magic, when he played, was 6’9” and weighed 215 pounds. Johnson did play point guard for most of his career, but Bird is still the superior rebound by a solid margin. Magic never averaged 10 boards per game in a season, and Bird averaged that number across his career.
- Larry
- Magic
5) Now we’ll look at steals and blocks – blocks (per games and total), block percentage, steals (per game and total), and steal percentage
| Stat | Johnson | Bird |
| Steals Per Game | 1.9 | 1.7 |
| Career Steals | 1,724 | 1,556 |
| Steal Percentage | 2.5 | 2.2 |
| Blocks Per Game | 0.4 | 0.8 |
| Career Blocks | 374 | 755 |
| Block Percentage | 0.6 | 1.2 |
This one is a little tough. Overall, Magic only has a slight edge in steals. But, he opened his career with five elite steal seasons, including two where he led the league in steals. Bird’s career high of 2.0 steals per game falls short of Johnson’s numbers in each of those first five seasons, and Johnson’s 1981 season (3.4 steals per game) produced the third highest steals average in NBA history. Then he entered his sixth season and never averaged more than 1.8 steals per game again. Because of that drop-off, I’m calling this one a tie. Bird roughly doubles Johnson’s career block numbers.
1) Larry
1) Magic
6) Now we’ll look at advanced offensive stats – offensive win shares, offensive box +/-, usage rate, and offensive rating
| Stat | Johnson | Bird |
| Offensive Win Shares | 110.6 | 86.8 |
| Offensive Box +/- | 5.9 (6th) | 5.1 (10th) |
| Usage Rate | 22.3 | 26.5 |
| Offensive Rating | 120.8 (4th) | 114.5 |
Johnson has the clear edge in offensive win shares, beating out Bird by nearly 25 win shares there. He has a slight edge in offensive box +/-, though both are historically great in that area. He also has the edge in offensive rating. That’s not the best stat to measure individual offensive importance or production, but it continues a theme for Johnson in this category. He’s the leader, even if Bird had the higher career usage rate. One likely cause for that – Magic played ten of his thirteen seasons with another all-time great in Kareem Abdul-Jabaar. Seven or so of those came with Kareem producing at an elite level even though he was in his 30s the whole time. Bird had good players around him, but none of Kareem’s offensive stature.
- Magic
- Larry
7) Now we’ll look at advanced defensive stats – defensive win shares, defensive box +/-, and defensive rating
| Stat | Johnson | Bird |
| Defensive Win Shares | 45.2 | 59.0 |
| Defensive Box +/- | 1.6 | 1.8 |
| Defensive Rating | 104 | 101.4 |
Bird was a stud defensively, something that often seems to be overlooked. He easily outpaces Johnson in defensive win shares, tops him in defensive box +/-, and has the edge in the more team-focused defensive rating stat. Bird led the league in defensive win shares four times and produced at least 5 defensive win shares in seven of his thirteen seasons. For reference, Johnson never topped 4.8 in a season and only topped 4 four times. For further reference, LeBron has only topped 5 defensive win shares four times in seventeen seasons, though his career high in 2009 (6.5 defensive win shares) beats out Bird’s best (6.2 in 1986).
- Larry
- Magic
8) Now we’ll look at overall advanced stats – PER, box +/-, win shares, win shares per 48 minutes, and VORP
| Stat | Johnson | Bird |
| PER | 24.1 | 23.5 |
| Box +/- | 7.5 (4th) | 6.9 (7th) |
| Win Shares | 155.8 | 145.8 |
| Win Shares Per 48 | .225 (9th) | .203 |
| VORP | 80.0 | 77.2 |
Bird has some impressive numbers here, but he trails Johnson in every category. It’s not by much in most cases, but it’s enough to give Magic the clear edge. The advanced stats love Magic a little more than they love Larry.
- Magic
- Larry
9) Now we’ll look at fouls and turnovers, just to be complete
| Stat | Johnson | Bird |
| Fouls Per Game | 2.3 | 2.5 |
| Turnovers Per Game | 3.9 | 3.1 |
The foul numbers are essentially the same, but Bird has an edge in turnover numbers. Both of these guys were high usage players who were asked to do a lot with the ball. Bird’s career usage rate is even higher than Johnson’s. Averaging nearly a turnover less per game in that context is impressive.
- Larry
- Magic
10) Now we’ll look at longevity – minutes played, minutes played per game, games played, and seasons played
| Stat | Johnson | Bird |
| Minutes Played | 33,245 | 34,443 |
| Minutes Per Game | 36.7 | 38.4 |
| Games Played | 906 | 897 |
| Seasons Played | 13 | 13 |
Bird played about two minutes per game more than Johnson. He led the league in minutes per game twice; Johnson never did. Both had relatively short careers (13 seasons) in comparison to other greats. Both had two seasons where they played under 50 games. Both dealt with health issues at the end of their career that prevented them from keeping those careers going. Bird had debilitating back issues; Johnson had HIV. That diagnosis gave him a four year break between his twelfth and thirteenth seasons, and his final season only lasted 32 games. Neither one of these guys is the hallmark of longevity, but I’ll give Bird the win because his minutes advantage is bigger than Magic’s tiny edge in games played.
- Larry
- Magic
11) Lastly, we’ll look at regular season awards
| Award | Johnson | Bird |
| Rookie of the Year | 0 | 1 |
| Defensive Player of the Year | 0 | 0 |
| MVP | 3 | 3 |
| Top 3 in MVP Voting (includes wins) | 9 | 8 |
| All-NBA First Team | 9 | 9 |
| All-NBA Second Team | 1 | 1 |
| All-NBA Third Team | 0 | 0 |
| All-Defensive First Team | 0 | 0 |
| All-Defensive Second Team | 0 | 3 |
| All-Rookie Team | 1 | 1 |
| All-Star Appearances | 12 | 12 |
Bird won Rookie of the Year over Johnson in 1980. He also made three All-Defense teams to Johnson’s zero. The rest of these numbers are identical. Both made three All-Star teams. Both won three MVPs. Both made ten All-NBA teams and landed on the First Team nine times. Johnson finished in the top 3 for MVP voting once more, but that’s not enough to overcome losing the Rookie of the Year award and Bird’s defensive award advantage.
- Larry
- Magic
So, where does that leave us? Who has the best regular season numbers? Who has the worst?
Let’s answer that question by looking back over the eleven categories. In the second column, I have them ranked on a points system based on how important I think that category is.
| Category | Points |
| Regular Season Awards | 6 |
| Historical Statistic Rankings | 6 |
| Overall Advanced Stats | 6 |
| Scoring | 3 |
| Passing | 3 |
| Rebounding | 3 |
| Steals and Blocks | 3 |
| Offensive Advanced Stats | 3 |
| Defensive Advanced Stats | 3 |
| Longevity | 3 |
| Turnovers and Fouls | 1 |
First place in a category gets you the number of points listed above. Second gets you ½ of that value. Let’s see how Magic and Larry stack up.
| Category | Magic | Larry |
| Regular Season Awards | 3 | 6 |
| Historical Statistic Rankings | 6 | 3 |
| Overall Advanced Stats | 6 | 3 |
| Scoring | 1.5 | 3 |
| Passing | 3 | 1.5 |
| Rebounding | 1.5 | 3 |
| Steals and Blocks | 3 | 3 |
| Offensive Advanced Stats | 3 | 1.5 |
| Defensive Advanced Stats | 1.5 | 3 |
| Longevity | 1.5 | 3 |
| Turnovers and Fouls | 0.5 | 1 |
| Total Points | 30.5 | 31 |
Well, there you have it. It’s as close as you can get based on regular season production.
- Larry – 31 points
- Magic – 30.5 points
Playoff Performance:
This is going to be more subjective than the first part, but I’ll do the best I can to come up with a comparable ranking here. There were, without ties, 60 points on the line for the numbers, so there will be 60 points on the line here as well. I have seven categories here – championships, Finals record, Finals appearances, Finals MVPs, supporting casts, opponents, and overall postseason record. Those first four and the last one are very clear measures of postseason success, while looking at supporting casts (in Finals seasons) and Finals opponents will give a little bit of context beyond the clear but basic measures that the other categories give us.
1) Let’s start with championships
| Player | Championships |
| Johnson | 5 |
| Bird | 3 |
Johnson has 5 titles. Bird has 3.
- Magic
- Larry
2) Now, we’ll look at Finals records
| Player | Finals Record | Finals Winning Percentage |
| Johnson | 5-4 | 55.6% |
| Bird | 3-2 | 60% |
I’m not going to punish Magic here just because his winning percentage was dragged down by his four additional Finals appearances. Both guys won in just over half of their trips to the Finals. It’s a tie.
1) Larry
1) Magic
3) Now we’ll look at Finals appearances
| Player | Finals Appearances | Percentage of Seasons with Finals Appearance |
| Jordan | 9 | 69.23% |
| Bird | 5 | 38.46% |
This isn’t even close. Johnson reached The Finals nine times. Nearly 70% of his seasons ended with a shot at the title. Bird made the last round 5 times, in just under 40% of his seasons.
- Magic
- Larry
4) Now let’s take a look at supporting casts
There’s no great way to measure a supporting cast, but I’ll use the top three teammate win shares for each Finals season. The seasons that ended in championships are in bold. The last column is the sum of the top 3 teammate postseason win shares. It’s not necessarily the win shares of the three players listed for that regular season, but those players are obviously among the top 3 in the playoffs too more often than not. To (sort of) measure roles, I italicized any teammates that produced more regular season win shares than Johnson or Bird, and the playoff win shares are italicized if one of those three didn’t lead the way in the playoffs that year. The seasons are more or less ranked by total combined regular season and playoff win shares, though there were some arbitrary decisions made when the numbers are close.
| Year/Team | Top WS Teammate | 2nd | 3rd | Total Top 3 WS | Top 3 WS in Playoffs |
| ‘80 Lakers | Kareem Abdul-Jabaar (14.8) | Jamaal Wilkes (10) | Norm Nixon (6.7) | 31.5 | 6.5 |
| ‘87 Celtics | Kevin McHale (14.8) | Robert Parish (9.2) | Danny Ainge (6.7) | 30.7 | 6.2 |
| ‘81 Celtics | Cedric Maxwell (11.0) | Robert Parish (10.9) | Tiny Archibald (6.9) | 28.8 | 5.2 |
| ‘86 Celtics | Kevin McHale (11) | Robert Parish (9.2) | Danny Ainge (6.8) | 27 | 7.4 |
| ‘84 Celtics | Robert Parish (10.5) | Kevin McHale (10.5) | Cedric Maxwell (6.4) | 27.4 | 6 |
| ‘88 Lakers | Byron Scott (10.7) | James Worthy (7.9) | A.C. Green (7.9) | 26.3 | 6.9 |
| ‘85 Celtics | Kevin McHale (11) | Robert Parish (9) | Danny Ainge (6.6) | 26.6 | 5.9 |
| ‘85 Lakers | Kareem Abdul-Jabaar (11.2) | James Worthy (7.5) | Byron Scott (6.9) | 25.6 | 6.8 |
| ‘87 Lakers | James Worthy (9.3) | Byron Scott (7.7) | A.C. Green (7.6) | 24.6 | 6.6 |
| ‘91 Lakers | James Worthy (9.0) | Vlade Divac (8.3) | Sam Perkins (8) | 25.3 | 5.4 |
| ‘89 Lakers | James Worthy (9.7) | A.C. Green (9.4) | Byron Scott (6.8) | 25.9 | 4.4 |
| ‘82 Lakers | Kareem Abdul-Jabaar (10.7) | Jamaal Wilkes (7.7) | Norm Nixon (6.6) | 25 | 4.2 |
| ‘84 Lakers | Kareem Abdul-Jabaar (8.9) | James Worthy (6.5) | Michael Cooper (6.5) | 21.9 | 7.3 |
| ‘83 Lakers | Kareem Abdul-Jabaar (10.9) | Jamaal Wilkes (7.4) | Michael Cooper (5.2) | 23.5 | 4 |
– Johnson had one regular season and two postseasons where he was topped in win shares by Abdul-Jabaar. Bird had one postseason where he was topped by McHale and one regular season where he fell 0.1 win shares behind Parish and 0.2 win shares behind Maxwell. Bird might get a slight edge in that regard, but it’s essentially even. These two were the best and most important players on their teams for the vast majority of their careers.
– Magic gains a clear edge over Bird in supporting cast strength. The top pieces around him weren’t quite as good on average as the top pieces around Bird. The ‘80 Lakers featured Kareem at the end of his prime and the best supporting cast on this list, but eight of the bottom nine supporting casts above belong to Magic’s teams. That means that five of the top seven belong to Bird’s teams. Supporting casts led by McHale, Maxwell, and Parish tended to be better at the top than those led by Worthy, Scott, Wilkes, and a Kareem on the wrong side of 30 (and 40 in ‘88 and ‘89). Bird, by these measures, had more help.
- Magic
- Larry
5) Now let’s look at Finals opponents
There are a number of ways to do this, but let’s keep it simple. We’re just going to look at SRS numbers. Championship wins are again in bold. The table is ordered by SRS margin, which is calculated by SRS – Opponent’s SRS.
| Year/Team | SRS | Opponent | Opponent’s SRS | SRS Margin |
| ‘86 Celtics | 9.06 | Rockets | 2.10 | +6.96 |
| ‘81 Celtics | 6.05 | Rockets | -0.20 | +6.25 |
| ‘84 Celtics | 6.43 | Lakers | 3.32 | +3.10 |
| ‘87 Lakers | 8.31 | Celtics | 6.57 | +1.74 |
| ‘80 Lakers | 5.40 | Sixers | 4.04 | +1.36 |
| ‘89 Lakers | 6.38 | Pistons | 6.24 | +0.14 |
| ‘85 Lakers | 6.48 | Celtics | 6.46 | +0.02 |
| ‘85 Celtics | 6.46 | Lakers | 6.48 | -0.02 |
| ‘88 Lakers | 4.81 | Pistons | 5.46 | -0.65 |
| ‘82 Lakers | 4.37 | Sixers | 5.74 | -1.37 |
| ‘87 Celtics | 6.57 | Lakers | 8.31 | -1.74 |
| ‘91 Lakers | 6.73 | Bulls | 8.57 | -1.84 |
| ‘83 Lakers | 5.06 | Sixers | 7.53 | -2.47 |
| ‘84 Lakers | 3.32 | Celtics | 6.42 | -3.10 |
– Bird’s three championships came against teams that were at least 3 points lower than the Celtics in SRS. He was 0-2 in the final round when his team didn’t hold the SRS edge.
– Johnson was 3-1 when his team held that edge, with the loss coming against a Pistons team that was essentially equal to the Lakers in SRS. He was 2-3 when his team didn’t hold the edge in SRS.
– Bird’s opponents were markedly worse when he won championships. Even the ‘87 Lakers, who would have been Johnson’s biggest favorite by SRS, only held an edge that was a little over half of Boston’s smallest SRS advantage in any of Bird’s title-winning years. Johnson had three more cracks at a Finals as an SRS underdog, but he still won two of those series. It’s unlikely that Bird wins two of three as an underdog if he had gotten that chance. Magic has the clear win here.
- Magic
- Larry
6) Now let’s look at Finals MVPs
| Player | Finals MVPs |
| Johnson | 3 |
| Bird | 2 |
Johnson won three Finals MVPs in five chances as a championship winner. Bird won two Finals MVPs in three chances as a championship winner. Magic has one more Finals MVP. Bird won it in a slightly higher percentage of his championship seasons. We’ll call it even.
1) Magic
1) Larry
7) Lastly, let’s take a look at overall playoff record
| Player | Playoff Record | Playoff Winning Percentage |
| Johnson | 128-62 | 67.37% |
| Bird | 99-65 | 60.37% |
Johnson won twenty-nine more playoff games. He lost three less playoff games. He takes this category running away.
- Magic
- Larry
So, where does that leave us? Was Johnson or Bird more impressive in the playoffs?
| Categories | Points |
| Championships | 10 |
| Finals Record | 7.5 |
| Finals Appearances | 5 |
| Supporting Casts | 5 |
| Opponents | 5 |
| Finals MVPs | 5 |
| Overall Playoff Record | 2.5 |
| Category | Magic | Larry |
| Championships | 10 | 5 |
| Finals Record | 7.5 | 7.5 |
| Finals Appearances | 5 | 2.5 |
| Supporting Casts | 5 | 2.5 |
| Opponents | 5 | 2.5 |
| Finals MVPs | 5 | 5 |
| Overall Playoff Record | 2.5 | 1.25 |
| Total Points | 40 | 26.25 |
And there you have that. Based on postseason success,
- Magic – 40 points
- Larry – 26.25 points
This brings us to the overall leaderboard, where we combine regular season production with postseason success to rank these two 4 and 5 in NBA history. Bird held a tiny edge in overall production, but these two are pretty much even there. Johnson pulls away with a clear advantage in postseason success. Bird wasn’t terrible there. He won three titles and two Finals MVPs. He won 99 playoff games. That’ll compare favorably to pretty much anyone. Just not Magic.
4) Magic Johnson – 70.5 points
5) Larry Bird – 57.25 points
A note that these point values have nothing to do with the overall top 15 rankings, so comparing them with other tiers wouldn’t be meaningful. They are just associated with each individual tier.
Next up is Tier 3 – Lakers Legends
* This page has been updated to reflect the fact that seasons played was not included in the 30+ stats that were used in category 1 of the regular season numbers section. It was also updated to reflect the fact that Magic and Bird won 0 and 0 scoring titles, not 10 and 2.