
Which team stats correlate most strongly with winning?
13 min read
Basketball is a game of many factors, and that makes it almost impossible to attribute success or failure to one statistic, especially those that measure just one aspect of the game (rebounding, passing, scoring, etc.). You can be bad in one area and still succeed overall because of a domination of other aspects of the game. Likewise, you can be a great team in one area and still struggle overall because of shortcomings elsewhere. Here are some 2020 examples –
- The Rockets and Raptors finished 22nd and 20th in FG%
- The Rockets, Lakers, and Bucks finished 24th, 21st, and 18th in 3PT%
- The Pacers, Thunder, Rockets, Nuggets, and Heat all finished in the bottom half of the league in rebounding
- The Rockets, Jazz, Thunder, and Celtics all placed in the bottom six in assists per game, while the Clippers joined them in the bottom ten
- The Lakers, Jazz, and Bucks finished 22nd, 21st, and 20th in turnovers (in the bad way), and the Heat and Raptors joined them in the bottom half of the league
- The Jazz and Mavs placed last and second-to-last in steals, with the Clippers and Bucks joining them in the bottom ten
- The Jazz finished 28th in blocks, and the Heat also finished below 20th
- The Clippers, Raptors, Rockets, and Celtics were among the eleven most foul-heavy teams in the league
- The Spurs were 5th in the league in FG%
- The Trail Blazers and Spurs were 3rd and 4th in 3PT%
- The Nets were 2nd in rebounding. The 21-win Knicks tied for 6th
- The Suns, Grizzlies, and Pelicans, who finished five, five, and twelve games under .500, were 1, 2, and 3 in assists per game
- The Spurs led the league in turnovers per game – by which I mean they averaged the fewest – and the Blazers and Magic placed 3rd and 4th
- The 22-win Bulls and 19-win Timberwolves placed 1st and 4th in steals per game
- The Blazers and T-Wolves placed 2nd and 4th in blocks per game
- The 19-46 Cavs, Magic, 23-42 Hornets, and Spurs all fouled less per game than five-sixths of the league
Even scoring isn’t immune to this effect. Five teams that fell short of the playoffs, including the 25-47 Wizards, placed in the top ten in points per game. The Jazz, Nuggets, Sixers, Thunder, and Pacers all stood between 18th and 23rd there despite making the playoffs easily.
It is important to note one observable difference between the two sides shown above. We see far more below average and just plain bad teams finishing in the top five of certain statistical categories than we see clear playoff teams finishing in the bottom five. It’s very possible for an objectively good team to be below average (and even bottom ten) in some stats, but it’s rare to see that kind of team completely bottom out somewhere over a full season. The same rule of rarity doesn’t apply to the bad and average teams reaching the top in a few areas.
One other note – the above point varies across stats as well. As we see above with the Jazz and Mavs bottoming out in steals while playoff teams barely even hit the bottom half in stats like FG% and 3PT%, there is a spectrum of importance here. And this is what we attempted to measure when we plotted team stats against winning percentage. There’s no one stat that will dictate overall performance, but some stats have to be more important than others. What exactly does that ordering look like?
What we put together isn’t a complete list by any means (we won’t go into more advanced metrics here for example), but it does provide a good look at how certain team stats have impacted winning percentage in the NBA. To quickly summarize, we plotted every team’s per game production in a given statistic (x-axis) against their winning percentage from that same season (y-axis). Every team from every year since, and including, 1997 was plotted, which leaves us with a sample of roughly 700 individual seasons. The correlation coefficient you will see at the top of each graph is a measure of the strength of the connection between the two variables. The further that decimal value moves from 0, the closer the rise in x is matched with a rise (or fall if its negative) in y.
- FG%
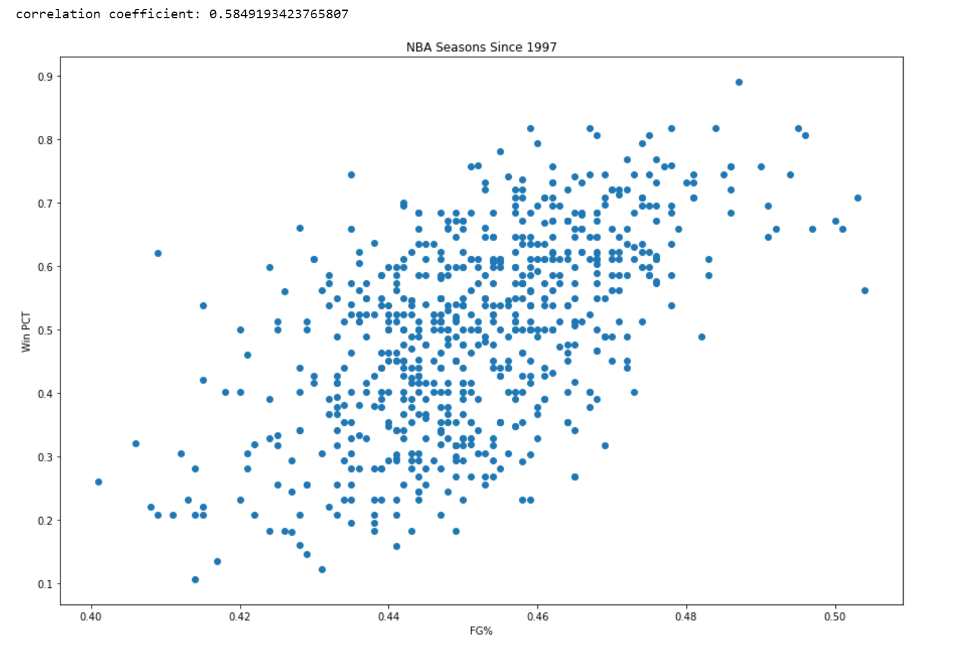
The correlation coefficient that we see here (0.58) is pretty strong considering that we’re looking at an individual variable in a scenario that relies on so many. It makes sense that it is. There are a lot of shots taken in each game, especially in comparison to assists, rebounds, steals, etc. The ’97 Blazers, for example, took 78.8 shots per game to rank 15th in the league. This year, the Nuggets sat in that (almost) middle position with 88.9 shots per game. Given those numbers, any significant difference in shooting percentages will put your team in an unfavorable position. Even a 2% difference in hit rate on 90 shots creates a two field goal advantage. For example, a team making 40% of 90 shots would hit 36 while a team making 38% of 90 shots would hit just 34.2. That’s just about a 4 point advantage by itself in a relatively typical game. In other words, a 2% difference in FG% between teams would not be all that rare, even over the course of a full season. That was the gap between the top and the middle of the league this year. A four point swing is pretty significant.
The other part of FG% that makes for the strong correlation is the directness of the connection with points. A higher FG% is a clear and direct measure of making more of your scoring opportunities. A rebound or steal, for example, can only promise a new or better scoring opportunity. There’s still more work to be done from there, and that introduces more variables that need to go your way, deflating the direct impact.
2. 3PT%
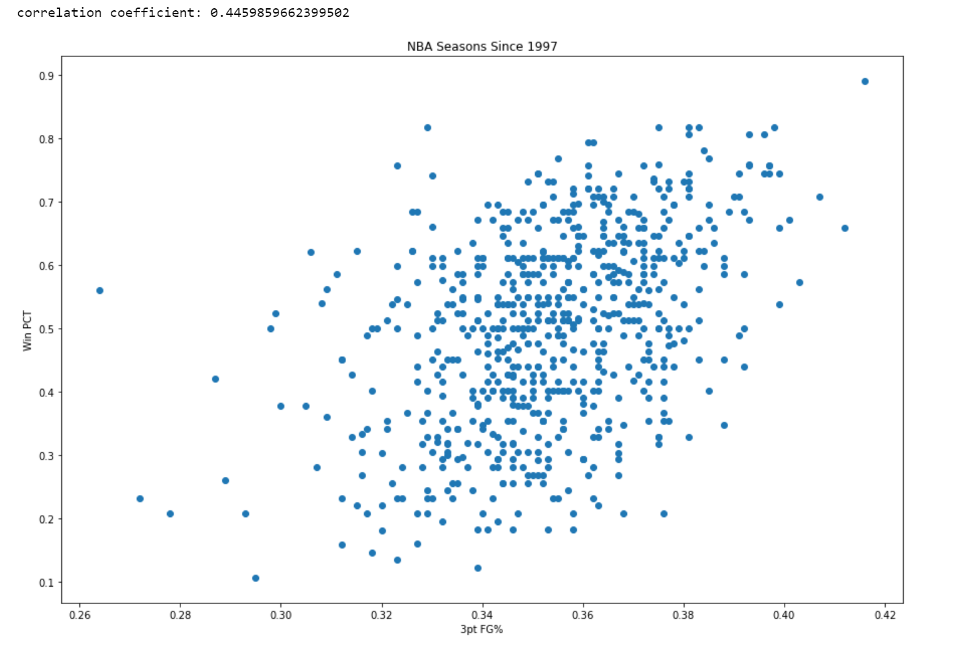
3PT% also leads to a stronger correlation, but it isn’t quite as high.
First, why is the correlation relatively strong? The math there is pretty simple. We’re talking about three points per shot, so gaps in shooting percentages are going to have a pretty significant impact. We see a difference of roughly 2% between the top and the middle of the league here too, with an average 3PA per game of roughly 34. That’s a difference of about 0.7 threes, or two points per game, which is relatively important. The same comments about the directness of shooting percentages applies here too.
Second, why is the correlation lower here than it is for FG%? I would think it comes down to simple volume. An individual three might mean more than the average field goal, but when you’re taking 80-90 field goals per game, that’s going to win the day over 34 threes. We see that with the calculated differences of 4 points above and just 2 points here. It’s also important to note that threes are being shot more than ever right now. Back in 1997, the average team was shooting just above 16 threes per game, which means that 2-point difference between FGs and 3Ps has been even greater in the lead-up to this season.
3. Assists
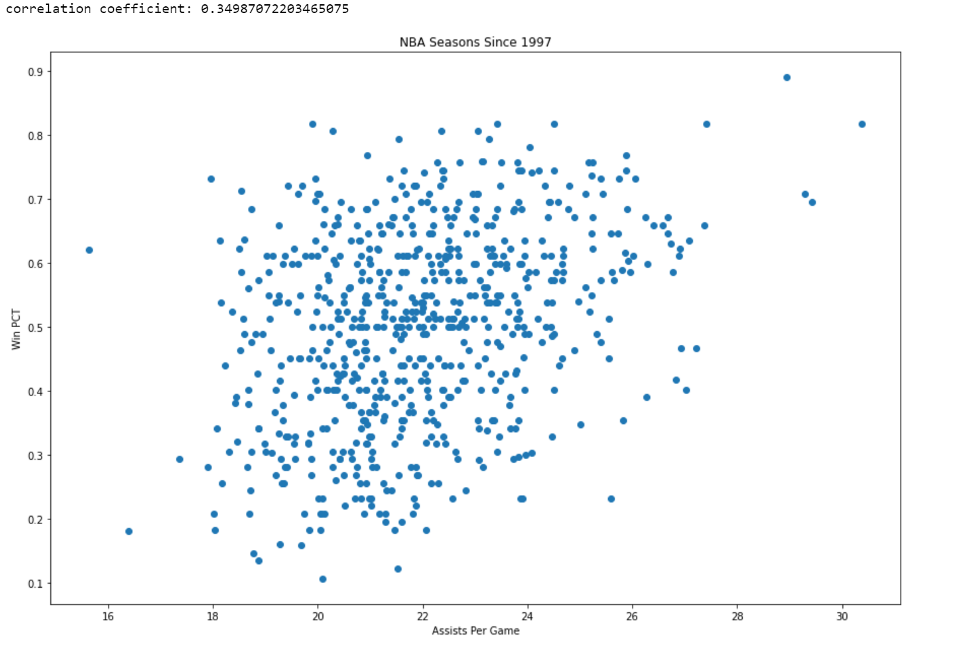
I was somewhat surprised to see assists come in here rather than a little bit lower, largely because you really don’t need to be a good passing team to be a good offensive team. The best example of this, or at least a very good one, is the Harden Rockets. Since Harden’s arrival in 2013, the Rockets have finished 6th, 4th, 12th, 7th, 2nd, 1st, 2nd, and 6th in scoring efficiency. In those same years, they finished 10th, 23rd, 10th, 15th, 4th, 22nd, 28th, and 29th in assist percentage, which tracks the percentage of scoring possessions that end in an assisted bucket. In recent years, Houston has produced a top two offense with the 4th highest percentage of assists, the 22nd highest percentage of assists, and the 28th highest percentage of assists.
Of course, the issue here, and the likely reason that I was off with my prediction, is that most teams don’t have James Harden and either Chris Paul or Russell Westbrook. Many teams don’t even have one of those guys. In those circumstances, assists should become a lot more important. A team without highly skilled isolation players is really going to struggle offensively – and then overall – if they can’t produce good looks for each other.
In the other direction, the reason that assists aren’t more important than this overall is that guys like Harden, Westbrook, and Paul, while not necessarily common, aren’t exactly rare in the league. There are a good number of players that can create their own offense consistently, and that allows a smaller but still easily significant amount of teams to thrive offensively and win a lot of games even if they don’t generate assists at an elite level.
4. Rebounds
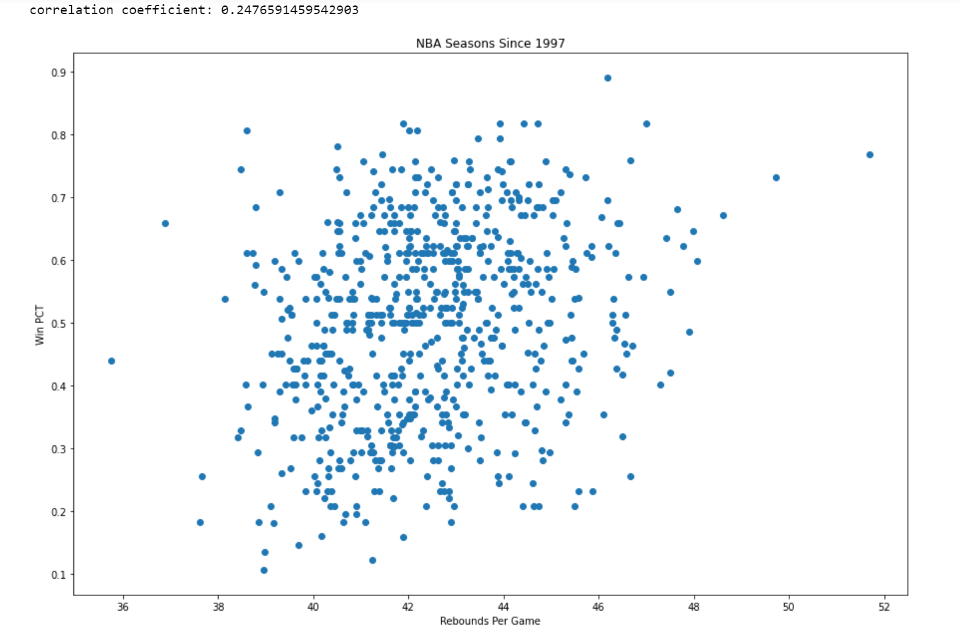
The correlation drops off further for rebounds. Why? I can think of a few reasons.
For one thing, the most important rebound in the game, at least on an individual basis, is likely the offensive rebound. These directly lead to an extra possession – and occasionally one that ends in a very easy put-back. Offensive rebounds can be very important. Yet, the ’97 Nets led our sample by averaging 17.2 offensive rebounds. More recently, the league leaders tend to sit around 12 or 13 offensive boards per game. An elite offense is scoring a little over 1 point per possession. Even if you figure that the possessions created by offensive boards, on average, might lead to a slightly higher rate of scoring given the easy looks they sometimes produce, that’s a max of 15-20 extra points coming off of offensive boards for the elite teams. The gap between the top and bottom in offensive rebounding has been anywhere between 3 and 7 rebounds over the last 24 years. Even at that extreme low, teams would still be in the range of 10 points per game from the offensive glass.
So, we’re looking at an absolute extreme of roughly 10 points per game coming off of differences in offensive rebounding, and that figure is likely far smaller today. To clarify, that difference exists only when a top offensive rebounding team faces off with a team that sits near the bottom of the league. So, in a relatively rare match-up, you would be very lucky to get a 10 point swing in your favor from offensive rebounding. Is that important? Yes, but that difference is going to shrink really quickly in more common match-ups.
This season, for example, the top-ranked Knicks (yes that’s right) pulled down just 1.8 more offensive boards per game than the middle of the league. That’s maybe two points more per game solely based on offensive rebounding. Now, this number looks awfully similar to the one I calculated for 3PT%, so why does the correlation get cut in half for overall rebounds? I would predict that three-point shooting is more predicative of offensive success than offensive rebounding. In other words, a team that hits more threes is more likely to be doing fine offensively – and thus be better overall – than a team that succeeds in the niche category of offensive rebounding (see the Knicks as a perfect example of this theory).
To go further into this point, we can look at the Spurs and Blazers way at the top of this article. They succeeded in 3PT% but were meh overall. Why? Offense is only half of the game, and both teams were terrible defensively. However, they were still average teams because of good offenses, driven in large part by their ability to connect from beyond the arc. The Knicks, Hornets, and Cavs, who all finished in the top five in offensive rebounding this season, were bad teams because their ability to grab offensive rebounds didn’t actually make them good – or even average – offensively.
Then there’s defensive rebounding. We see roughly three defensive rebounds for every offensive rebound, but it’s a little harder to examine them given the difficulty in drawing direct connections to other opportunities. For example, a team with an elite outlet passer like Bill Walton or Kevin Love (a more modern and lesser example) might gain a little more advantage from defensive rebounding. When one of those players grabs the board, they’re able to more effectively turn it into a good opportunity on the other end. The same would apply with someone like prime Russell Westbrook, who could self-start the occasional fast break possession off of a defensive board. However, those differences, if they even exist, would be very small and rare.
There’s two other pieces of defensive rebounding to talk about. First, we need to recognize that you have to force someone to miss a shot before you can rebound. You can obviously be a good defensive rebounding team regardless of your defensive prowess, but this means that per game defensive rebounding numbers are likely just as much a measure of your defense as they are a measure of your ability to protect the glass. Pace will also further muddy the waters here. A team that plays fast and forces a lot of misses (see the Bucks) is going to look very good on the defensive glass just by virtue of all of their opportunities to grab rebounds. That makes it very hard to quantify the exact impact of defensive rebounding itself, which leaves us in a spot that makes sense with the given correlation coefficient (roughly 0.25). Rebounds are important, but the general lack of separation between good and bad teams and all of the variables at play make it hard to draw a strong connection between them and winning.
The other thing we can point to here is that good defensive rebounding will inhibit offensive rebounding, which should lead to some positive defensive impact. However, there just isn’t much of a gap between the great and terrible defensive rebounding teams. Outside of the Budenholzer Bucks, who have absolutely dominated the glass defensively and produced the two-best rebounding seasons in the last 24 years (they’re still very elite on the boards despite the other factors going their way), the gap between the top and the bottom of the league has been a relatively consistent 5-6 defensive boards per game. When you consider all of the factors that go into rebounding, how many possessions does that really save you? Probably not too many.
5. Steals
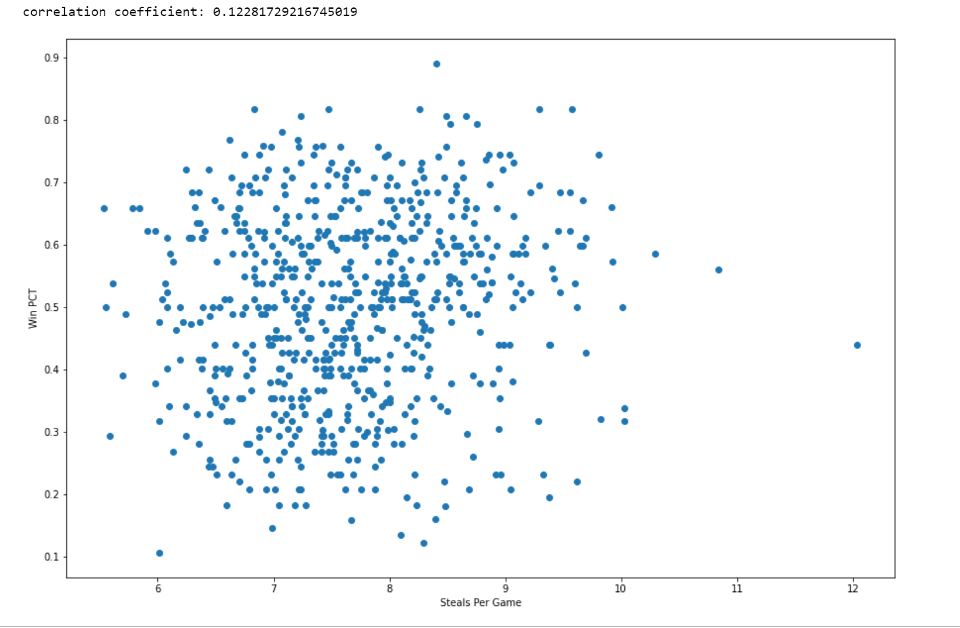
Steals fall at the bottom in this group of stats, and it makes sense. We would likely see a very similar plot for blocks. Why? There are just so few steals and blocks in any given game. To put this perspective, look at that data point all the way to the right. The ’98 Celtics averaged 12 steals per game, the most any team has averaged in the last twenty-four seasons. Andre Drummond has averaged more than 13 rebounds per game by himself every year since 2014. The overwhelming majority of possessions end in a shot (or a dead ball turnover), and that drowns out the impact of steals (and blocks) over the full course of a game. That doesn’t mean they aren’t important when they occur – they can often be crucial for jump starting the fast break and easy scoring opportunities – but the volume is just too low for a massive overall impact. The difference between a good and bad steals team is 3-4 per game, and that means maybe four possessions where you end up with an easier look at the basket in an match-up between the best and the worst. Is that important? Sure. But an elite fast break team might score about 1.2 points per fast break possession (like the league-best Suns this season), which isn’t any more than 0.1 points higher than a good overall offense. If we’re looking at a difference of 3-4 extra fast break possessions between the two extremes in terms of steals, that isn’t going to have a very big impact on the overall score. A gap that has a hard cap around 0.5 points per game does mean something – and probably more than it might seem based on such a small number – but that impact is going to get swallowed up over the course of a full game in comparison to other factors.
A Few Other Graphs
One thing we looked at – has the correlation for FG% and 3PT% changed in recent years with the uptick in three-point attempts? It has, and in a positive direction for both. We looked at seasons since, and including, 2013, when the average three-point attempts per game finally hit 20. Here are the results –
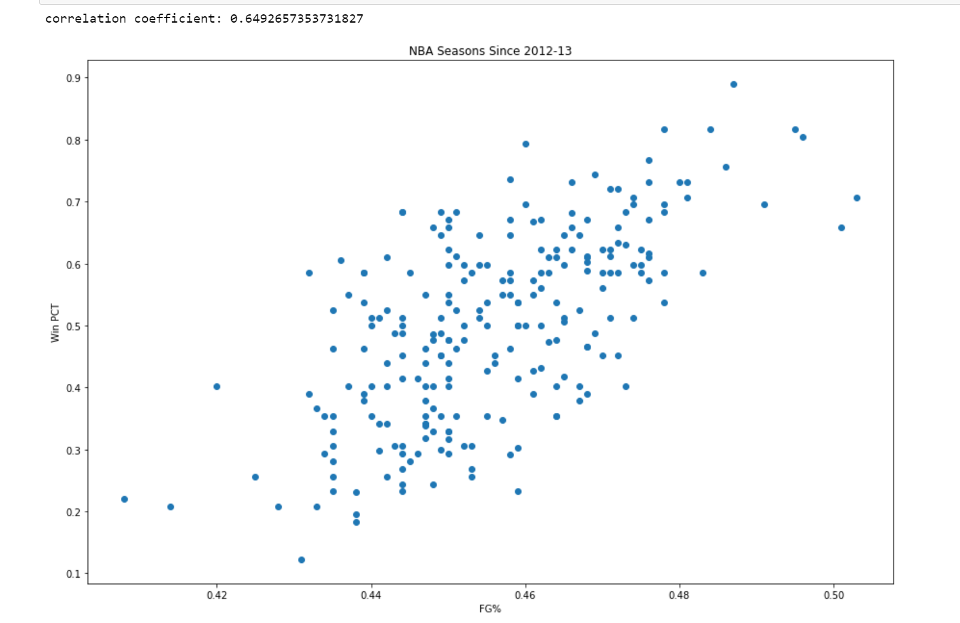
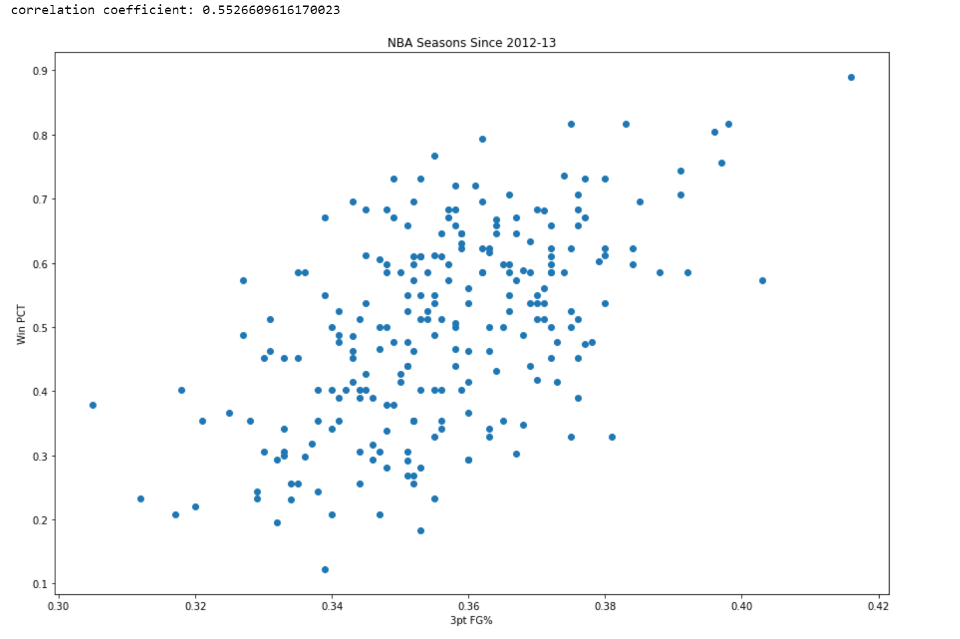
We see a significant rise in the correlation of both with what is still a decent sample size (240 team seasons).
The 3PT% part makes sense. Threes are becoming a much bigger part of the offensive game as teams take more and more of them. Being an elite three-point shooting team in 2020 is simply more impactful than being an elite three-point shooting team in 1997.
But why the rise in correlation between FG% and winning percentage? Our general theory – teams have also been moving out of the midrange in recent years. You rarely see anyone other than the Chris Pauls and Khris Middletons of the world take shots that aren’t in the paint or beyond the arc, and even those guys have cut back on their midrange attempts. The teams that have done this most effectively – both by more aggressively cutting out inefficient shots like 16-foot jumpers and long floaters and by coming up with more effective ways to get good looks at the rim (and thus make a higher percentage of their shots) – have been the most successful offensively and overall. That’s likely not an all-encompassing answer for the change, but it should describe at least some of it.
Lastly, we dug a little deeper into steals with two more graphs.
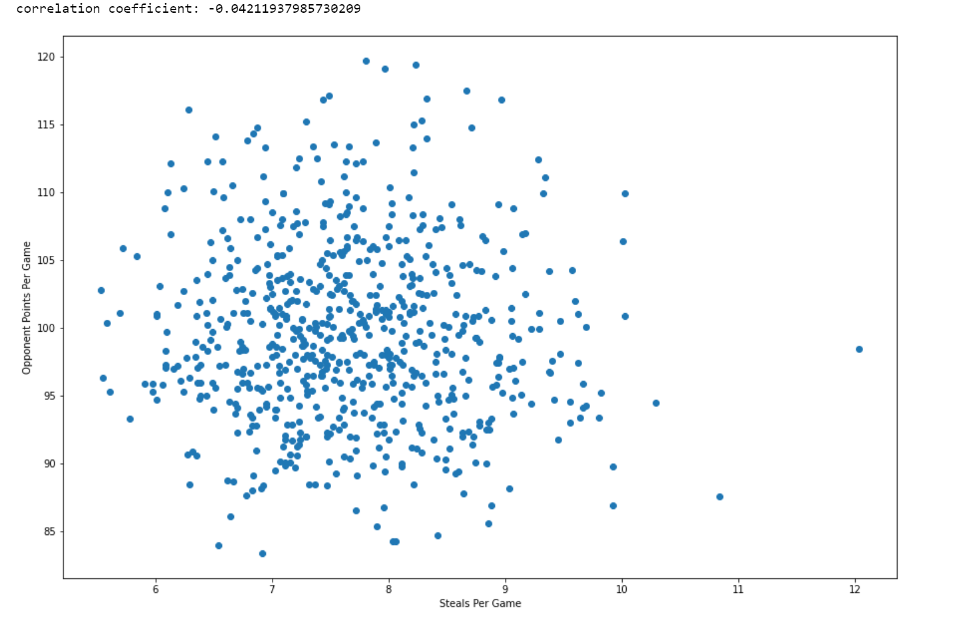
First, we see what is essentially zero correlation between steals and opponent points per game. The likely explanation – the vast majority of defensive possessions end in the other team taking a shot, so your ability to make that shot difficult more often than not is going to be the determining factor defensively. Steals are so limited in number that they’re not going to swing your defense, especially because a team’s ability to grab steals doesn’t mean they’re any good at the other parts of defense. It’s also possible that any effect one team’s steals has on limiting opponent scoring is balanced out by their own turnovers, which will create easier scoring opportunities going the other way.
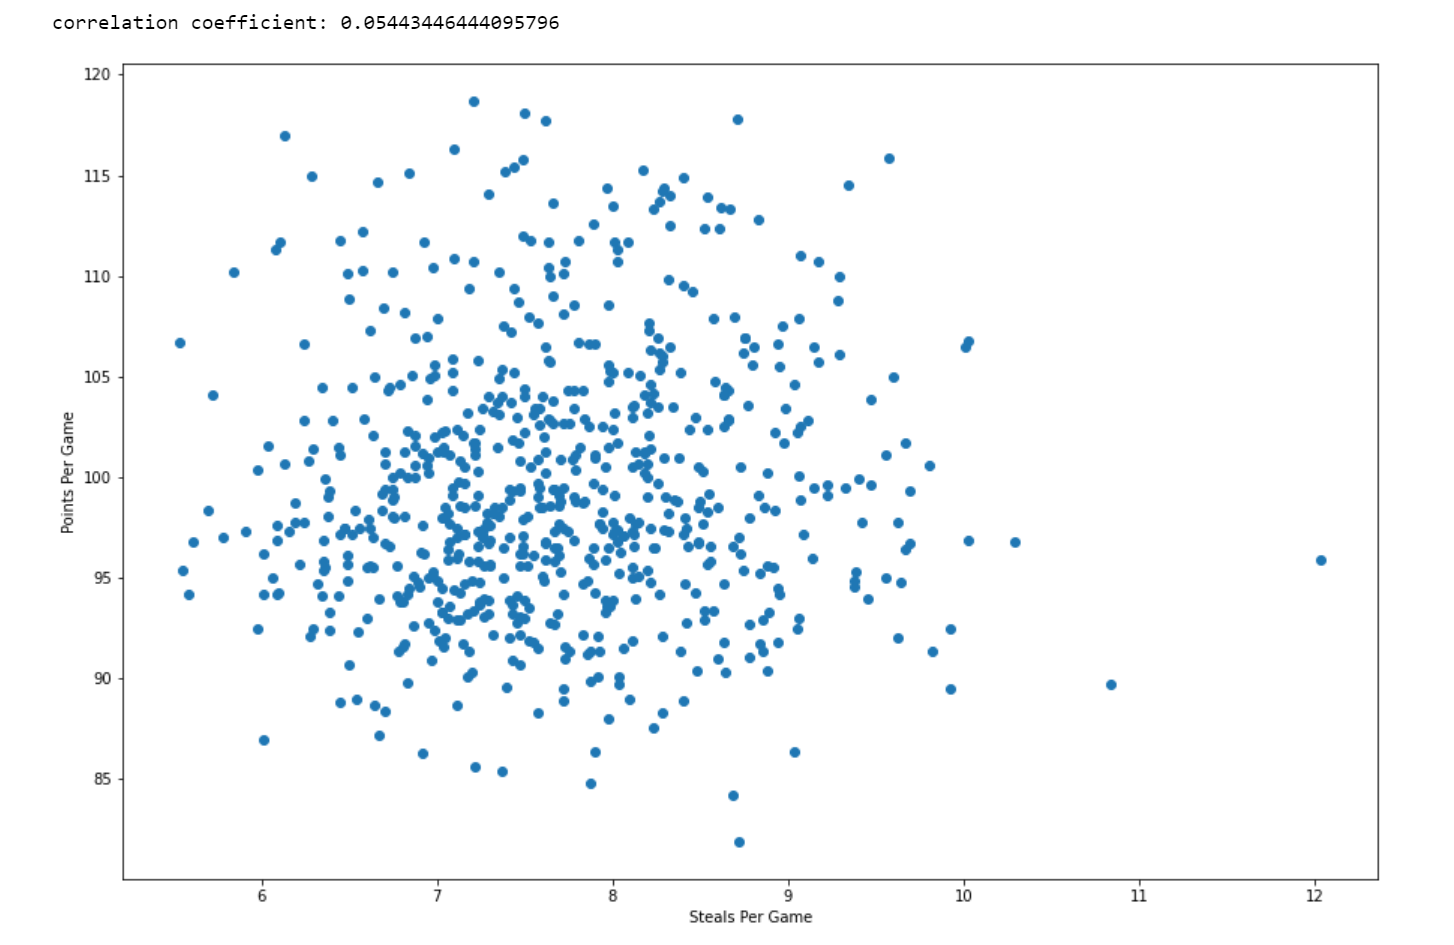
We also see very little correlation with steals and offensive scoring. The same theme is going to be key here too. Steals might lead to a few possessions per game where you have a good look in the fast break, but you still have to score on all of your other possessions, which make up the vast majority of the game. A team’s ability to grab steals has zero impact on the quality of their half-court offense.
I truly appreciate this article. Thanks Again. Keep writing. Kassey Enos Fevre
Your way of explaining all in this paragraph is truly fastidious, every one be capable of easily know it, Thanks a lot. Gae Creighton Amory
Its not my first time to visit this site, i am browsing this web site dailly and take nice information from here all the time. Mina Leif Tarah