The Greats Series – Tier 4
22 min read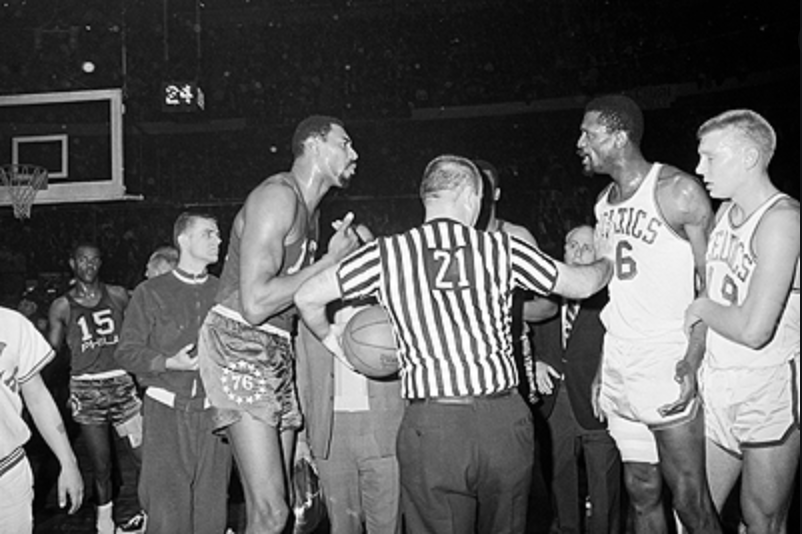
Who are the Fifteen Greatest NBA Players of All Time?
First, a few notes. One, this is a reflection of how I see things today. Any active players can obviously change the equation with the rest of their careers. Two, “greatest” for me is a mix between career production and playoff success. To be in this group, you need to have one of three things – great numbers and great playoff performance, all-time numbers and decent playoff performance, or decent numbers and all-time playoff performance. Third, I will be breaking these rankings into tiers. Those tiers are based on small (or big in some cases) gaps between a set of players and the guys behind them.
Here is Tier 4, the competition for the eighth and ninth spots.
TIER 4: The Best of the ‘60s
Bill Russell
Wilt Chamberlain
All stats from Basketball-Reference, the best basketball site on the Internet.
No one in NBA history has more impressive numbers than Wilt Chamberlain. Not MJ. Not Kareem. Not LeBron. Not D.J. Wilson. Not anyone.
– Wilt averaged at least 33.5 points per game over the first seven years of his career. MJ (3 times), Elgin Baylor (3), and James Harden (2) are the only other players in NBA history to average that many points in a season. Wilt holds the top three season scoring averages in NBA history, as well as four of the top five and five of the top seven. He is the only player in NBA history to average 40 points per game over a full season. He is the only player in NBA history to average 50 points per game over a full season. He is the only player to score 100 points in an NBA game.
– Wilt averaged at least 18.2 rebounds per game in all fourteen of his seasons. Russell actually did the same (though he only played thirteen seasons), but no other player has more than five such seasons. Both Russell and Chamberlain have 10 seasons with 20 or more rebounds per game. Here’s where Wilt really separates himself as a rebounder – he owns the top three and six of the top seven season rebounding averages in NBA history. Russell can’t match him at the top.
There’s more.
– Wilt is the only seven footer in NBA history to average five or more assists per game in four seasons. Nikola Jokic is fast on his tail with three – including this season – but Chamberlain still holds that long-standing record for now.
– Only one player in NBA history has averaged more than 46.0 minutes per game in an NBA season – though Oscar Robertson and Tiny Archibald were both right at that number once. That player is Wilt, who did it seven times. He never averaged less than 42 minutes per game in a season. In 1962, he topped 48 minutes per game by playing ten overtime periods and only sitting for seven total minutes on the season. Let me repeat that. In 1962, Wilt Chamberlain played all but seven possible minutes over an 80 game regular season. He averaged 50 points and 25 boards per game that year.
– He also owns the best field goal percentage in an NBA season (72.7%), though both Mitchell Robinson and Dwight Howard are surprisingly on pace to break that record this season. Who knows what happens with that.
There’s more.
– Giannis Antetokounmpo is on pace to produce the twelfth season in NBA history with a PER of 31 or higher (among those who have played at least 20 games). Wilt has three of those, including the highest (31.8), second-highest (31.7 and a tie with MJ and LeBron), and third-highest (31.6 and a tie with MJ, LeBron, and, for now, Giannis). Only Jordan has more of those 31+ PER seasons with four.
– Wilt also produced six seasons of at least 20 win shares. Only Kareem, MJ, and George Mikan come close (three each). Chamberlain has the second, fourth, seventh, and eighth best win share seasons in NBA history. Only Kareem (1, 5, 6) can match him at the top.
– Wilt owns the top three, four of the top six, and five of the top eight Free Throw attempt rate seasons in NBA history. Only Charles Barkley (two of the top eight) is remotely close.
There’s more.
– Nope. That’s just about it. There are only so many stats that they tracked back in the 60s. It was a different time.
If this were purely based on statistical resumes, Wilt might take the cake. Here’s the problem. Chamberlain won two titles in fourteen years as the most talented player in a league that had somewhere between eight and seventeen teams throughout his career. That doesn’t scream GOAT. He also won less MVPs than Russell despite the superior stats, which would suggest that the people that watched Wilt play knew he wasn’t quite as valuable to winning as the numbers might suggest. I can’t dock him for only playing 14 seasons (a relative “only” compared to other all-time greats) given just how much he played when he was in the league, but it feels like a 20 year-career or something in that region would be the numbers capstone required to solidify Wilt’s campaign as a top five player. He has all-time stats, but he just has decent postseason performances to his name – and I would say at this point without taking too much of a deep dive that that last adjective is somewhat generous. He’s sitting near the bottom of the top ten as a result. Again, like last time, I’ll just say that being one of the ten best players to ever play in a league that’s been around for seven decades is one heck of an accomplishment. Saying that Wilt isn’t top five isn’t a knock on him as much as it’s an acknowledgment of just how special the few guys I have ranked ahead of him were.
So, after that, the question is probably this – Why is Russell so low? He won those five MVPs. He won eleven championships in thirteen seasons! The man has a strong case to be named the greatest winner in the history of team sports. He unquestionably was an all-time winner. I don’t think the same can be said about his statistical production. I’ll start with the positives.
– Russell was a phenomenal rebounder. There’s no debating that. There’s probably questions to be had there about how to compare rebounding numbers from the ‘60s to today, as forty-four of the forty-six NBA seasons in which a player averaged at least 18 rebounds per game happened before 1975, but, even in their era, Russell stood out with Chamberlain. Of those forty-six seasons, the eighteen with the highest rebound averages belong to either Bill or Wilt. That’s absurd. All twenty-seven of their combined seasons end up on that list, which means that Bill Russell and Wilt Chamberlain own twenty-seven of the top forty-six rebounding seasons in NBA history by rebounds per game. That’s mind blowing, regardless of how the shifting game has brought down the rebounding averages of everyone but Dennis Rodman (made the list twice) since the mid seventies.
– Russell’s other big statistical argument comes from defensive win shares, where he has the six best seasons of all-time. He also has the 10th, 11th, 13th, 17th, 30th, and 32nd best seasons in NBA history by total defensive win shares. Russell is the DWS king, though Wilt is within a few arms’ distance with seven seasons of at least seven defensive win shares produced compared to Russell’s twelve.
– Russell finished second all-time in average minutes per game, and was one of eight players to start a career before 1980 and finish with over 40,000 minutes played
– Russell was pretty good as a passer, hitting four assists per game in eight seasons. Those are good, if not exceptional, passing numbers for a big from any era.
– It’s also fair to point out that there were a number of stats that weren’t recorded when Russell (and Wilt) played, including blocks, where Russell likely would have impressive numbers.
Unfortunately for Russell, that’s really where his all-time production argument ends.
– He never scored more than 18.9 points per game in a season, ending his career with an average of 15.1 points per game. That first number, which was, again, Russell’s best season as a scorer, is beneath Magic’s career average by roughly a point, and Magic easily has the weakest scoring case among my top seven. That 18.9 points per game season was only the ninety-fifth best scoring season that any NBA player put up across Russell’s career. That’s a thirteen year snapshot of a seventy year league. Russell barely cracks the top 100, and the league was smaller than pretty much any other time when he played.
– Russell never shot better than 46.7% from the floor in a full season. For reference, Chamberlain’s worst shooting season had him at 46.1% from the floor. That was his only season below 50%, and he shot nearly 9 times more per game than Russell overall. Russell’s best season from the field was only the ninety-seventh best shooting season that any NBA player put up across his career, and he played the position that most typically leads to higher shooting percentages.
– Wilt averaged more minutes per game in nine of his fourteen seasons – and averaged the same amount in a tenth – than Russell did in his best minutes season. He is also, due to his relatively shorter career, eighth out of eight in total minutes played in that previously mentioned group that started a career before 1980 and finished with over 40,000 minutes played. He played a ton of minutes, but nits need to be picked when we’re distinguishing between legends.
– Russell only produced 29.9 total offensive win shares in 13 seasons, a number that was outpaced by Chamberlain if you just combine his two best offensive win share seasons (33.1 combined offensive win shares in ‘62 and ‘63). Read that again.
– Russell’s best PER season (22.8) would have been Wilt’s eleventh best. That number is only the 83rd best PER season in all NBA seasons through 1975. That’s a little under half of the league’s history, and Russell’s best PER season sits at 83rd.
– Russell’s best season by true shooting percentage (50%) would have been Wilt’s fourteenth best. If you take all of the NBA seasons through 1975, take out anyone who didn’t play at least 20 games, and then rank those seasons by true shooting percentage, Russell’s best season clocks in at…841st.
Russell put up numbers; you don’t win eleven championships if you don’t. Those numbers, as a whole, just aren’t really all that close to being on the same level as the other guys that we’ve seen so far in these rankings, and that’s why Russell, like Wilt, is ranked here near the bottom of the top 10. The championships, in a league that was (at most) half of today’s size, don’t carry enough weight to overcome the statistical shortcomings.
The Regular Season Numbers:
A longer description of this process can be found here, but here’s the gist – we have 34 total stats that we’re looking at, along with turnovers, fouls, and seasons played (not part of the 35), and regular season awards. I would note for this tier specifically that a decent amount of those 34 stats were either not recorded at all or only partially recorded during the careers of Russell and Chamberlain. We’re going to go through what we can, but any sort of overall comparison between tiers – especially of category 1 – should be done with those limitations in mind.
1) Let’s start with a look at how each player’s statistical profiles (the 34) rank up historically. Keep in mind that some stats, including block and steal numbers, offensive rebounds, defensive rebounds, VORP, and box +/- numbers were not recorded for these two
| Stats in the… | Russell | Chamberlain |
| Top 100 | 7 | 13 |
| Top 50 | 7 | 13 |
| Top 25 | 5 | 11 |
| Top 10 | 4 | 11 |
| Top 5 | 4 | 8 |
| Top 3 | 4 | 7 |
| Best All Time | 1 | 3 |
If the argument above on Russell’s stats didn’t convince you that he lacks an all-time argument there, then hopefully this does. Rebounding, minutes per game, and defensive win shares are the only stats that keep Russell afloat here, while Chamberlain has a significant statistical argument despite the lack of recorded stats from his era. He almost doubles up Russell in every single slot here.
- Wilt
- Bill
2) Now we’ll look at scoring stats: points (per game and total), Field Goal %, Effective Field Goal %, True Shooting %, Three-Point %, and Free Throw %. We’ll also throw in Scoring Championships here.
| Stat | Russell | Chamberlain |
| Points Per Game | 15.1 | 30.1 (2nd all-time) |
| Career Points | 14,522 | 31,419 (7th) |
| FG% | 44 | 54 |
| EFG% | 44 | 54 |
| TS% | 47.1 | 54.7 |
| 3P% | N/A | N/A |
| FT% | 56.1 | 51.1 |
| Scoring Champ | 0 | 7 |
Wilt averaged 15 points more per game across his career. He scored nearly 17,000 more points than Russell. That difference between the two is more points than Russell scored in his career. Wilt is one of the more dominant scorers in NBA history. Russell was never even one of the more dominant scorers in the league just during his era. Chamberlain’s shooting numbers are also better. The only edge Russell has here is free throw percentage. That’s obviously not enough.
- Wilt
- Bill
3) Now we’ll look at passing stats – assists (per game and total) and assist percentage, which was recorded beginning with the ‘64-’65 season
| Stat | Russell | Chamberlain |
| Assists Per Game | 4.3 | 4.4 |
| Career Assists | 4,100 | 4,643 |
| Assists Percentage | 14.9 | 15.8 |
Russell is really close here. He only trails Chamberlain by 0.1 assists per game. He would be a lot closer in total assists if he had played the roughly 80 extra games that Chamberlain played. He only trails in assist percentage by 0.9%. But he still trails, and Wilt has the top two and four of the top six passing seasons between the two. He also somehow led the league in total assists in ‘68. He wins here.
- Wilt
- Bill
4) Now we’ll look at rebounding stats – rebounds (per game and total). The stats are unfortunately not there for offensive rebounds (per game and total), defensive rebounds (total), and rebound percentage, which was only recorded for the last three seasons of Chamberlain’s career.
| Stat | Russell | Chamberlain |
| Rebounds Per Game | 22.5 (2nd) | 22.9 (1st) |
| Career Rebounds | 21,620 (2nd) | 23,924 (1st) |
| Offensive Rebounds Per Game | N/A | N/A |
| Career Offensive Rebounds | N/A | N/A |
| Career Defensive Rebounds | N/A | N/A |
| Rebound Percentage | N/A | 19.4 |
Again Russell is close but not close enough. Chamberlain has slightly better overall numbers and the three best seasons in NBA history by rebounds per game. He led the league in rebounds per game in eleven of his fourteen seasons while Russell did it five times. Both have ten seasons with at least 20 boards per game. This is a battle between the two best volume rebounders in NBA history, but that doesn’t mean there isn’t a winner and a loser.
- Wilt
- Bill
5) Here we usually look at steals and blocks – blocks (per games and total), block percentage, steals (per game and total), and steal percentage – but those weren’t recorded back in the day. There are no winners here.
- ?
- ?
6) Now we’ll look at advanced offensive stats – offensive win shares, offensive box +/-, usage rate, and offensive rating. Unfortunately, offensive win shares are the only available stat here.
| Stat | Russell | Chamberlain |
| Offensive Win Shares | 29.9 | 153.3 (3rd) |
| Offensive Box +/- | N/A | N/A |
| Usage Rate | N/A | N/A |
| Offensive Rating | N/A | N/A |
Fortunately, the winner is still clear. Over the courses of their full careers, Wilt produced 5.13 offensive win shares for every one that Russell produced.
- Wilt
- Bill
7) Now we’ll look at advanced defensive stats – defensive win shares, defensive box +/-, and defensive rating. Win shares, this time defensive, are again the only available stat.
| Stat | Russell | Chamberlain |
| Defensive Win Shares | 133.6 (1st) | 93.9 (5th) |
| Defensive Box +/- | N/A | N/A |
| Defensive Rating | N/A | N/A |
Again, the winner is clear. Wilt puts up more of a fight than Russell did in the previous category, but Bill still takes it home easily with a win share edge of nearly 40 despite playing eighty less games.
- Bill
- Wilt
8) Now we’ll look at overall advanced stats – PER, box +/-, win shares, win shares per 48 minutes, and VORP. PER and win shares (total and per 48) are the only available stats here, though this is at least a step up from the last few sections.
| Stat | Russell | Chamberlain |
| PER | 18.9 | 26.1 (6th) |
| Box +/- | N/A | N/A |
| Win Shares | 163.5 | 247.3 (2nd) |
| Win Shares Per 48 | 0.193 | .248 (3rd) |
| VORP | N/A | N/A |
Wilt is in the top six all-time in all three stats here. He obviously wins this category, so I’m going to talk a little bit about how impressive his win share numbers are. Kareem and Wilt are the only two players in NBA history to be top five all-time in both defensive and offensive win shares, and Wilt is set to stay there for quite a while unless either Dwight Howard or LeBron somehow post roughly 20 defensive win shares over their last few seasons. Kareem, at first in offensive win shares and third in defensive win shares, might stay there forever. Karl Malone is the only other player to be in the top 10 for both. LeBron, Shaq, and John Stockton are the only other players to be top 20 in both. Of those four guys, only LeBron (2nd in offensive win shares) is in the top five in either stat. Don’t let the fact that guys like Kareem and Wilt played a few decades ago mask just how impressive their statistical production was. Russell’s numbers here are solid. His overall win share numbers are even pretty dang good. They’re just nowhere near Wilt’s.
- Wilt
- Bill
9) This is where we normally look at fouls and turnovers, but turnovers, believe it or not, weren’t recorded back then either.
| Stat | Russell | Chamberlain |
| Fouls Per Game | 2.7 | 2 |
| Turnovers Per Game | N/A | N/A |
I will not be giving anyone an edge solely because they committed 0.7 less fouls per game than their opponent. That, to me, is about as meaningless as it gets. No one wins this category either.
- ?
- ?
10) Now we’ll look at longevity – minutes played, minutes played per game, games played, and seasons played
| Stat | Russell | Chamberlain |
| Minutes Played | 40,726 | 47,859 (10th) |
| Minutes Per Game | 42.3 (2nd) | 45.8 (1st) |
| Games Played | 963 | 1,045 |
| Seasons Played | 13 | 14 |
Russell played the second most minutes per game in NBA history, and he still trails Wilt here by 3.5 minutes per game. Wilt’s per game minutes were unreal, and he also played 82 more games than Russell. This is yet another example of Russell being pretty good or even great statistically, yet falling short to Wilt’s unbelievable numbers.
- Wilt
- Bill
11) Lastly, we’ll look at regular season awards. The All-Rookie Team was not started until 1963, after both players’ rookie seasons. The first Defensive Player of the Year was not named until 1983, when both were well into retirement. The All-Defensive team was not started until 1969, which was Russell’s final season.
| Award | Russell | Chamberlain |
| Rookie of the Year | 0 | 1 |
| Defensive Player of the Year | N/A | N/A |
| MVP | 5 | 4 |
| Top 3 in MVP Voting (includes wins) | 9 | 7 |
| All-NBA First Team | 3 | 7 |
| All-NBA Second Team | 8 | 3 |
| All-NBA Third Team | 0 | 0 |
| All-Defensive First Team | 1 | 2 |
| All-Defensive Second Team | 0 | 0 |
| All-Rookie Team | N/A | N/A |
| All-Star Appearances | 12 | 13 |
This is pretty even.
- Rookie of the Year: Wilt
- MVP: Russell. He won five MVPs and finished in the top three nine times. For Chamberlain, those numbers are four and seven.
- All-NBA teams: Wilt. He made seven All-NBA first teams while Russell only made three. Russell made eleven total All-NBA teams to Wilt’s ten.
- All-Defensive Teams: Inconclusive. Wilt made the All-Defensive team twice, but that was in five seasons. Russell did it in his only try. There’s just not enough data there to make a call either way.
- ASG: Even. Both made the All-Star Game in every year but one.
- Wilt has the edge in two of those five categories, but Russell has the edge in MVPs. Given that Wilt still won four MVPs and that the seven All-NBA first team appearances more than double Russell’s number, I’ll give him the narrow win here. The Rookie of the Year helps push him over the edge as well.
- Wilt
- Bill
So, where does that leave us? Who has the best regular season numbers? Who has the worst?
Let’s answer that question by looking back over the eleven categories. In the second column, I have them ranked on a points system based on how important I think that category is.
| Category | Points |
| Regular Season Awards | 6 |
| Historical Statistic Rankings | 6 |
| Overall Advanced Stats | 6 |
| Scoring | 3 |
| Passing | 3 |
| Rebounding | 3 |
| Steals and Blocks | 3 |
| Offensive Advanced Stats | 3 |
| Defensive Advanced Stats | 3 |
| Longevity | 3 |
| Turnovers and Fouls | 1 |
First place in a category gets you the number of points listed above. Second gets you ½ of that value. Let’s see how Russell and Chamberlain stack up.
| Category | Bill | Wilt |
| Regular Season Awards | 3 | 6 |
| Historical Statistic Rankings | 3 | 6 |
| Overall Advanced Stats | 3 | 6 |
| Scoring | 1.5 | 3 |
| Passing | 1.5 | 3 |
| Rebounding | 1.5 | 3 |
| Steals and Blocks | N/A | N/A |
| Offensive Advanced Stats | 1.5 | 3 |
| Defensive Advanced Stats | 3 | 1.5 |
| Longevity | 1.5 | 3 |
| Turnovers and Fouls | N/A | N/A |
| Total Points | 19.5 | 34.5 |
Well, there you have it.
- Wilt Chamberlain – 34.5 points
- Bill Russell – 19.5 points
Chamberlain has a huge edge heading into playoff performance, but this is where Russell had his best moments. Can he catch up? The suspense is killing me.
Playoff Performance:
This is going to be more subjective than the first part, but I’ll do the best I can to come up with a comparable ranking here. There were, without ties and with the lack of available numbers in some cases, 54 points on the line for the numbers, so I’m not sure how I’m going to adjust the scoring here to make up for the six point drop off. We’ll see when we get there. I have seven categories here – championships, Finals record, Finals appearances, Finals MVPs, supporting casts, opponents, and overall postseason record. Those first four and the last one are very clear measures of postseason success, while looking at supporting casts (in Finals seasons) and Finals opponents will give a little bit of context beyond the clear but basic measures that the other categories give us.
1) Let’s start with championships
| Player | Championships |
| Russell | 11 |
| Chamberlain | 2 |
This is a rough look for Chamberlain. No other way to put it.
- Bill
- Wilt
2) Now, we’ll look at Finals records
| Player | Finals Record | Finals Winning Percentage |
| Russell | 11-1 | 91.67% |
| Chamberlain | 2-4 | 33.33% |
Copy and paste from above. The numbers speak for themselves. Russell’s ability to win in the postseason is legendary.
- Bill
- Wilt
3) Now we’ll look at Finals appearances
| Player | Finals Appearances | Percentage of Seasons with Finals Appearance |
| Russell | 12 | 92.31% |
| Chamberlain | 6 | 42.86% |
Chamberlain made The Finals in over 40% of his seasons. That’s a really solid number that is right in line with guys like MJ and Larry Bird. He obviously didn’t win as many titles as he could have, but he got to the final stage a decent amount of times. Russell makes his accomplishments look tiny here. I can’t really wrap my head around what making The Finals in over 90% of your seasons would look like. He made twelve Finals in thirteen seasons. Even in a smaller league, that’s an incredible feat. The only thing that I can think of that comes close is LeBron making eight straight Finals from 2011 to 2018, and even that is a little pale in comparison to Russell’s accomplishments, especially considering the huge gap in Finals wins between the two.
- Bill
- Wilt
4) Now let’s take a look at supporting casts
There’s no great way to measure a supporting cast, but I’ll use the top three teammate win shares for each Finals season. The seasons that ended in championships are in bold. The last column is the sum of the top 3 teammate postseason win shares. It’s not necessarily the win shares of the three players listed for that regular season, but those players are obviously among the top 3 in the playoffs too more often than not. To (sort of) measure roles, I italicized any teammates that produced more regular season win shares than Russell or Chamberlain, and the playoff win shares are italicized if one of those two didn’t lead the way in the playoffs that year. The seasons are more or less ranked by total combined regular season and playoff win shares, though there were some arbitrary decisions made when the numbers are close.
| Year/Team | Top WS Teammate | 2nd | 3rd | Total Top 3 WS | Top 3 WS in Playoffs |
| ‘72 Lakers | Jerry West (13.3) | Gail Goodrich (12.3) | Happy Hairston (9.2) | 34.9 | 5.2 |
| ‘70 Lakers* | Jerry West (15.2) | Elgin Baylor (7.8) | Happy Hairston (7.7) | 30.7 | 5.9 |
| ‘68 Celtics | Bailey Howell (10.1) | Sam Jones (7.7) | John Havlicek (7.6) | 25.4 | 6.9 |
| ‘69 Celtics | Bailey Howell (11.3) | Don Nelson (7.5) | John Havlicek (7.3) | 26.1 | 6.2 |
| ‘65 Celtics | Sam Jones (12.8) | Tom Sanders (7.5) | K.C. Jones (6.7) | 27 | 4.3 |
| ‘69 Lakers | Jerry West (10.8) | Elgin Baylor (8.5) | Mel Counts (4.3) | 23.6 | 6.8 |
| ‘57 Celtics | Bill Sharman (10.4) | Bob Cousy (8.8) | Tom Heinsohn (7.1) | 26.3 | 3.9 |
| ‘67 Sixers | Chet Walker (10.1) | Hal Greer (7.6) | Billy Cunningham (6.8) | 24.5 | 5.4 |
| ‘73 Lakers | Jerry West (10.6) | Gail Goodrich (8.1) | Bill Bridges (6.5) | 25.2 | 5.5 |
| ‘62 Celtics | Sam Jones (9.6) | Tom Heinsohn (9.3) | Frank Ramsey (7.3) | 26.1 | 3.8 |
| ‘58 Celtics | Frank Ramsey (10) | Bill Sharman (8.7) | Tom Heinsohn (6) | 24.7 | 4.7 |
| ‘64 Celtics | Sam Jones (8.9) | John Havlicek (7.7) | Tom Sanders (7.6) | 24.2 | 3.8 |
| ‘60 Celtics | Bill Sharman (7.9) | Bob Cousy (7.8) | Tom Heinsohn (7.7) | 23.4 | 4.4 |
| ‘66 Celtics | Sam Jones (10) | K.C. Jones (6.6) | Larry Siegfried (5.8) | 22.4 | 5.1 |
| ‘63 Celtics | Sam Jones (9.6) | Tom Sanders (6.8) | Tom Heinsohn (6.8) | 23.2 | 4.3 |
| ‘59 Celtics | Bob Cousy (8.7) | Bill Sharman (7.6) | Tom Heinsohn (6.5) | 22.8 | 4.3 |
| ‘61 Celtics | Sam Jones (8.1) | Bill Sharman (7.2) | Tom Heinsohn (6.6) | 21.9 | 3.8 |
| ‘64 Warriors | Tom Meschery (7.5) | Al Attles (5.3) | Guy Rodgers (4) | 16.8 | 2.8 |
*Wilt played 12 regular season games in 1970 due to a knee injury
- Chamberlain had the two best supporting casts on this list, though the teammate win shares from the ‘70 season are likely partly attributable to his absence and the larger roles for others that resulted.
- He also had the worst supporting cast here by a decent amount. The ‘64 Warriors were not particularly good behind their star.
- In his five full regular seasons in Finals years, Wilt never trailed a teammate in win share production. He led his team in playoff win shares in four of the six seasons above, with fantastic postseason campaigns from Jerry West leading to the two exceptions.
- Russell’s supporting casts were worse on average. That difference is largely due to that incredible ‘72 Lakers season (where Wilt still led the charge) and the ‘70 Lakers seasons (where Wilt essentially sat out), but Chamberlain’s teammates were also just more impactful – according to win shares produced – in the postseason. .
- Russell had teammates produce higher regular season win share totals than him in his rookie season and his last two seasons. He didn’t lead his team in postseason win shares in five of his twelve Finals runs.
- Average total regular season top three teammate win shares in Wilt’s six Finals seasons: 25.95. Average total regular season top three teammate win shares in Russell’s twelve Finals seasons: 24.46. Edge: Russell.
- Average total postseason top three teammate win shares in Wilt’s six Finals seasons: 5.27. Average total postseason top three teammate win shares in Russell’s twelve Finals seasons: 4.63. Edge: Russell.
- Wilt was the team leader in win shares more regularly, but Russell also reached the Finals six more times than Chamberlain. That means a lot more chances to fall behind a teammate in win share production, and it weakens Wilt’s argument here a little bit. Cut Russell’s seasons in half, and the averages would suggest that you’re looking at a noticeable decrease in seasons in which other players led the Celtics in win shares. This argument isn’t enough to give Wilt this category.
- Bill
- Wilt
5) Now let’s look at Finals opponents
There are a number of ways to do this, but let’s keep it simple. We’re just going to look at SRS numbers, which are a measure that looks at both margin of victory and strength of schedule. The higher the SRS, the better the team is in relation to the rest of the league. Championship wins are again in bold. The table is ordered by SRS margin, which is calculated by SRS – Opponent’s SRS.
| Year/Team | SRS | Opponent | Opponent’s SRS | SRS Margin |
| ‘72 Lakers | 11.65 | Knicks | 2.28 | +9.37 |
| ‘59 Celtics | 5.84 | MN Lakers | -1.42 | +7.26 |
| ‘62 Celtics | 8.25 | Lakers | 1.80 | +6.45 |
| ‘60 Celtics | 7.62 | STL Hawks | 1.77 | +5.85 |
| ‘67 Sixers | 8.50 | Warriors | 2.67 | +5.83 |
| ‘65 Celtics | 7.46 | Lakers | 1.70 | +5.76 |
| ‘57 Celtics | 4.78 | STL Hawks | -0.27 | +5.05 |
| ‘58 Celtics | 5.01 | STL Hawks | 0.82 | +4.19 |
| ‘63 Celtics | 6.38 | Lakers | 2.67 | +3.71 |
| ‘64 Celtics | 6.93 | Warriors | 4.41 | +2.52 |
| ‘73 Lakers | 8.16 | Knicks | 6.07 | +2.09 |
| ‘61 Celtics | 4.94 | STL Hawks | 2.99 | +1.95 |
| ‘66 Celtics | 4.34 | Lakers | 2.76 | +1.58 |
| ‘69 Celtics | 5.35 | Lakers | 3.84 | +1.51 |
| ‘68 Celtics | 3.87 | Lakers | 4.99 | -1.12 |
| ‘69 Lakers | 3.84 | Celtics | 5.35 | -1.51 |
| ‘64 Warriors | 4.41 | Celtics | 6.93 | -2.52 |
| ‘70 Lakers | 1.76 | Knicks | 8.42 | -6.66 |
Russell: 11 of 12 Finals as SRS favorite
Chamberlain: 3 of 6 Finals as SRS favorite
Don’t think it needs to be any more complicated than that. Russell’s teams went into eight of his twelve Finals with at least a two point edge over the opponent in SRS. He also lost one as a favorite, which makes up for Wilt and the Lakers doing the same in ‘73. The ‘72 Lakers were incredible, and the ‘67 Sixers were pretty dang good as well. But both teams took care of business, and Wilt’s other teams weren’t as good on their own or in comparison to their Finals opponents.
Just to drive this home, Russell’s Celtics were, on average, 3.73 points better by SRS than their Finals opponent. Wilt’s teams were, on average, only 1.1 points better, even with that huge advantage in the ‘72 Finals
- Wilt
- Bill
6) Now let’s look at Finals MVPs
| Player | Finals MVPs |
| Russell | 0* |
| Chamberlain | 1 |
Here’s the deal. Jerry West was named the first Finals MVP. That happened in 1969, which happened to be Russell’s final season. You obviously can’t win an award that they’re not handing out, so Russell has zero of these. However, the NBA named the Finals MVP trophy after him a little over a decade ago. So, technically, in my book, he wins this thing every year. I’m making the executive decision to hand this category to Russell.
- Bill
- Wilt
7) Now let’s take a look at overall playoff record
| Player | Playoff Record | Playoff Winning Percentage |
| Russell | 107-58 | 64.85% |
| Chamberlain | 88-72 | 55% |
This isn’t close at all. Russell won more and lost less in the playoffs.
- Bill
- Wilt
| Categories | Points |
| Championships | 10 |
| Finals Record | 7.5 |
| Finals Appearances | 5 |
| Supporting Casts | 5 |
| Opponents | 5 |
| Finals MVPs | 5 |
| Overall Playoff Record | 2.5 |
First place in a category gets you the number of points listed above. Second gets you ½ of that value. Let’s see how Russell and Chamberlain stack up.
| Category | Bill | Wilt |
| Championships | 10 | 5 |
| Finals Record | 7.5 | 3.75 |
| Finals Appearances | 5 | 2.5 |
| Supporting Casts | 5 | 2.5 |
| Opponents | 2.5 | 5 |
| Finals MVPs | 5 | 2.5 |
| Overall Playoff Record | 2.5 | 1.25 |
| Total Points | 37.5 | 22.5 |
And there you have that. Based on postseason success,
- Bill Russell – 37.5 points
- Wilt Chamberlain – 22.5 points
Now, technically, adding these to the regular season production numbers will put a little extra emphasis on the postseason since there’s 60 points available here but only 54 available up there. One potential solution would be to just multiply these numbers by 0.9 to bring the total down to 54, but, the way the system is set up, there are more categories in regular season production, which means that a total domination (say winning every category but one like both Wilt and Russell did here) means a little bit more in the regular season numbers section. That means that Wilt would win even though both he and Russell dominated one overall section, which, technically, would put a little extra emphasis on regular season numbers. So, it’s time to make another executive decision as the president of these tier rankings. As things stand, both players won their overall section by 15 points, which would mean an overall tie. That, to me, seems fitting. Wilt’s numbers make Russell’s numbers jealous. Russell’s rings make Wilt’s rings jealous. A tie is in order for the two best players of their era.
This brings us to the overall leaderboard, where we combine regular season production with postseason success to rank these two 8 and 8 in NBA history.
8) Wilt Chamberlain – 57 points
8) Bill Russell – 57 points
A note that these point values have nothing to do with the overall top 15 rankings. They are just associated with each individual tier.
Next up is Tier 5, where we take a look at two elite big men who played in the state of Texas.